
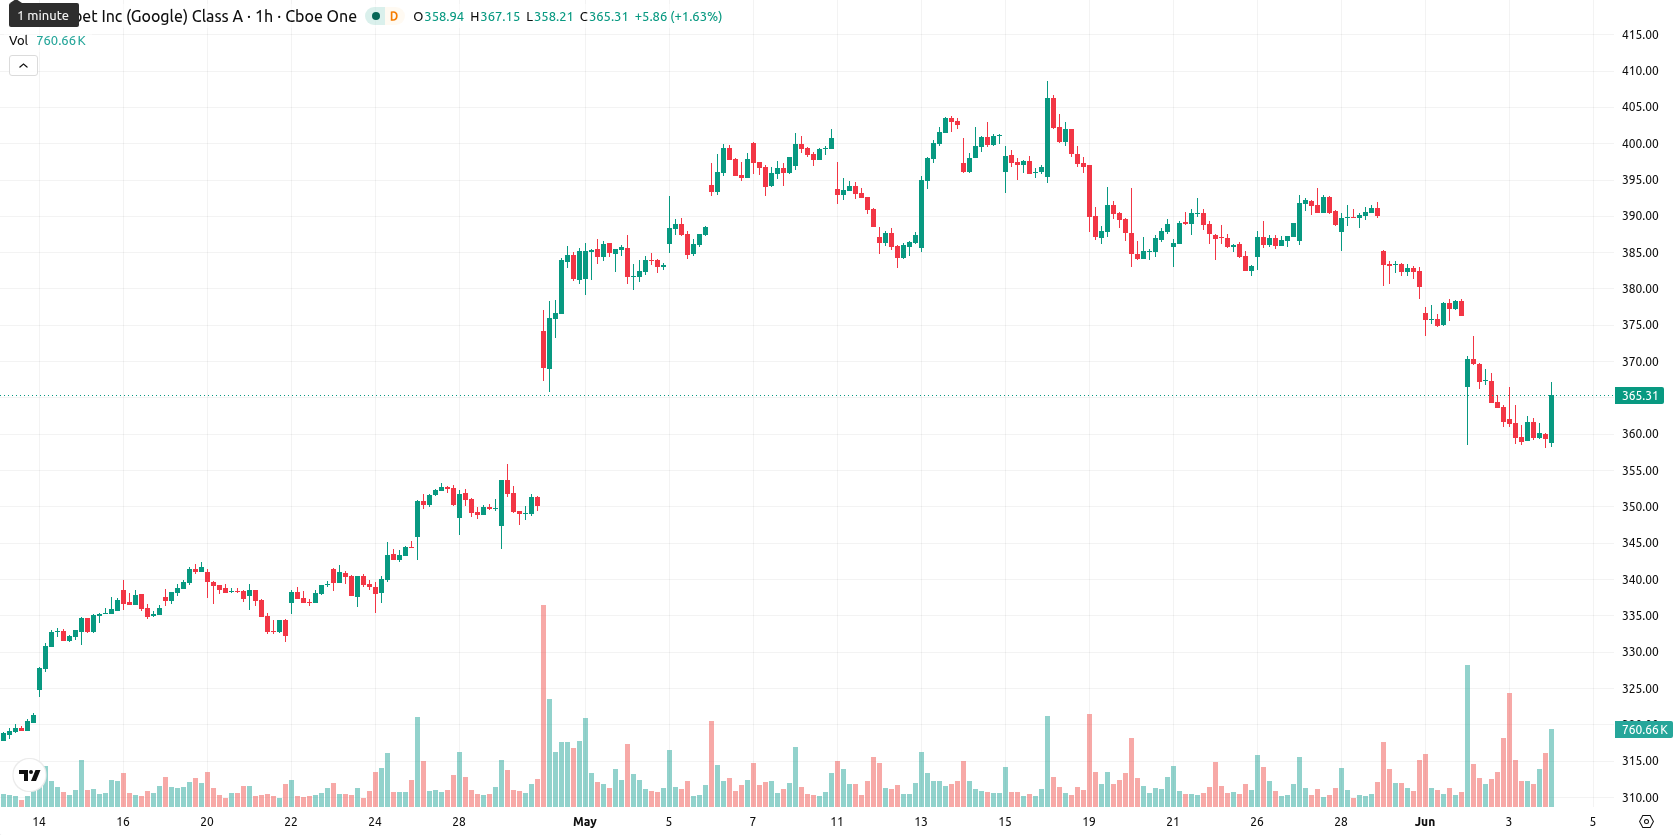
Alphabet stock price forecast: Facing $371.05 resistance as GOOGL advances 2.19% to $366.57

Alphabet Inc. (GOOGL) stock is trading at $366.57, up 2.19% on the day. The price remains below its key short- and medium-term moving averages, reflecting pressure from recent sessions.
Highlights
- Alphabet launches an $84.75 billion equity offering, its first major issuance since 2004, to fund AI infrastructure expansion.
- Berkshire Hathaway anchors the deal with a $10 billion investment, boosting market confidence and supporting execution liquidity.
- GOOGL trades below short- and medium-term averages with bearish momentum signals, likely to stay in a $355.17–$377.97 range over the next 2–3 days.
AI infrastructure push drives share issuance amid Berkshire backing
Alphabet has launched a major $84.75 billion equity financing round to fund the buildout of its AI infrastructure, marking its first significant share issuance since its 2004 IPO. The offering is anchored by a $10 billion investment from Berkshire Hathaway, providing market confidence in the placement and supporting liquidity for execution. While nearly 40% of proceeds are earmarked for tax liabilities, the transaction also highlights Alphabet's commitments to both innovation and shareholder obligations. The company's engagement in the U.S. municipal pre-paid energy bond market, alongside rapid user growth for Gemini AI at over 900 million monthly users, illustrates its drive to diversify financing sources and respond to surging product demand.
Intraday seller control as technicals turn negative and oversold
GOOGL is trading below the MA-20 at $367.28 and MA-50 at $379.46 on the hourly chart, while it remains above the MA-200 at $302.35 on the daily timeframe. Immediate resistance is defined by the Ichimoku Kijun at $371.05. Momentum indicators are negative: MACD and ADX both display Sell signals, and both RSI (22.2) and CCI are in oversold readings. Stoch RSI is Neutral, introducing some divergence, and BBP is also Oversold, suggesting strong intraday seller dominance; the Awesome Oscillator is Neutral and does not confirm current momentum trends.
Bearish bias dominates as volatility band limits upside potential
Over the next 2–3 trading days, GOOGL is expected to trade within the $355.17–$377.97 volatility range. A move to the downside is considered more likely, while an upward breakout appears less probable. The baseline scenario is continued rangebound action between support and resistance; if bullish momentum emerges, a move above $371.05 could develop, whereas sustained selling could lead to a test of the lower end of the forecast band.
Previously it was reported that U.S. regulatory scrutiny of digital infrastructure particularly in areas critical to national security, has positioned Alphabet and similar firms to benefit from tighter oversight and expedited approvals for strategic projects. The recent equity financing not only underscores Alphabet’s continued focus on long-term innovation and infrastructure expansion but also introduces fresh execution risks tied to ongoing market volatility, making sustained price action above $371.05 a key level to monitor in the days ahead.


Latest Google News


-
 Afghanistan
-
 Albania
-
 Algeria
-
 Angola
-
 Argentina
-
 Armenia
-
 Australia
-
 Austria
-
 Azerbaijan
-
 Bahamas
-
 Bahrain
-
 Bangladesh
-
 Belarus
-
 Belgium
-
 Bolivia
-
 Botswana
-
 Brazil
-
 Brunei
-
 Bulgaria
-
 Cambodia
-
 Cameroon
-
 Canada
-
 Chile
Chile
-
 China
China
-
 Colombia
-
 Congo
Congo
-
 Costa Rica
-
 Cote d'Ivoire
-
 Croatia
-
 Cuba
Cuba
-
 Cyprus
-
 Czechia
-
 DR Congo
-
 Denmark
-
 Dominican Republic
-
 Ecuador
-
 Egypt
Egypt
-
 El Salvador
-
 Estonia
-
 Eswatini
-
 Ethiopia
-
 Finland
-
 France
-
 Georgia
-
 Germany
-
 Ghana
Ghana
-
 Greece
-
 Haiti
Haiti
-
 Hong Kong
-
 Hungary
-
 India
India
-
 Indonesia
-
 Iran, Islamic republic
-
 Iraq
Iraq
-
 Ireland
-
 Israel
-
 Italy
Italy
-
 Jamaica
-
 Japan
Japan
-
 Jordan
-
 Kazakhstan
-
 Kenya
Kenya
-
 Korea
Korea
-
 Kuwait
-
 Kyrgyzstan
-
 Laos
Laos
-
 Latvia
-
 Lebanon
-
 Lesotho
-
 Libya
Libya
-
 Lithuania
-
 Luxembourg
-
 Madagascar
-
 Malaysia
-
 Malta
Malta
-
 Mauritius
-
 Mexico
-
 Moldova
-
 Mongolia
-
 Montenegro
-
 Morocco
-
 Mozambique
-
 Myanmar
-
 Namibia
-
 Nepal
Nepal
-
 Netherlands
-
 New Zealand
-
 Nigeria
-
 North Macedonia
-
 Norway
-
 Oman
Oman
-
 Pakistan
-
 Palestine
-
 Panama
-
 Papua New Guinea
-
 Paraguay
-
 Peru
Peru
-
 Philippines
-
 Poland
-
 Portugal
-
 Puerto Rico
-
 Qatar
Qatar
-
 Reunion
-
 Romania
-
 Rwanda
-
 Saudi Arabia
-
 Serbia
-
 Singapore
-
 Slovakia
-
 Slovenia
-
 Somalia
-
 South Africa
-
 Spain
Spain
-
 Sri Lanka
-
 Sweden
-
 Switzerland
-
 Syria
Syria
-
 Taiwan
-
 Tajikistan
-
 Tanzania
-
 Thailand
-
 Trinidad and Tobago
-
 Tunisia
-
 Turkey
-
 UAE
UAE
-
 Uganda
-
 Ukraine
-
 United Kingdom
-
United States
-
 Uruguay
-
 Uzbekistan
-
 Venezuela
-
 Vietnam
-
 Yemen
Yemen
-
 Zambia
-
 Zimbabwe
- Forex
- Crypto
