
Apple stock holds steady as EU delays AI feature launch on regulatory grounds

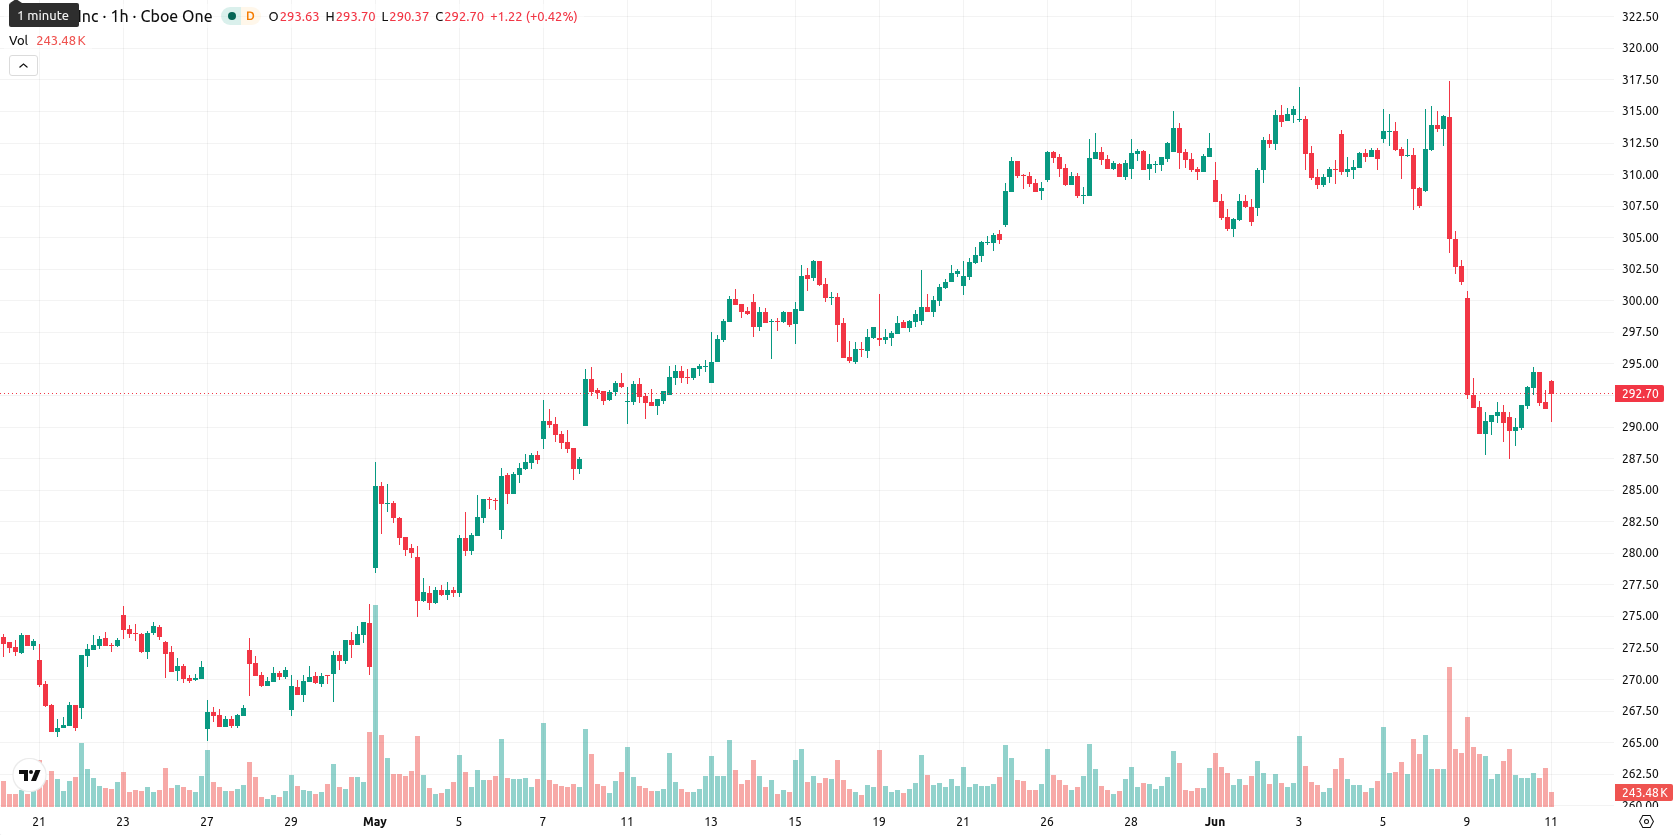
Apple Inc. (AAPL) stock is trading at $291.64, slipping 0.16% intraday and currently positioned below its key moving averages. The price remains above its long-term trend levels, reflecting a mixed technical backdrop amid moderate session volatility.
Highlights
- Apple authorized an additional $100 billion in share buybacks, mechanically reducing share float and supporting per-share metrics.
- Quarterly revenue jumped 17% year-over-year to $111.2 billion, but AI feature launches in the EU and China face regulatory delays.
- Shares trade below key moving averages with bearish technical bias, expected to remain rangebound between $278.39 and $304.89.
Share buyback and AI setbacks shift sentiment amid strong earnings
Apple authorized an additional $100 billion in share buybacks, which mechanically reduces the share float and supports per-share financial metrics. The company also reported quarterly revenue of $111.2 billion, representing a 17% year-over-year increase, and earnings per share of $2.01, both reflecting strong recent operational results. However, updated AI-powered Siri and Apple Intelligence features will initially roll out only in the U.S. and selected markets as regulatory restrictions delay launches in the European Union and China, following the European Commission's denial of Apple's request for an exemption from the Digital Markets Act. These developments have influenced sentiment, though price action has remained under broader selling pressure.
Seller momentum prevails as technicals flash mixed signals
AAPL is trading below both the MA-20 at $293.60 and MA-50 at $304.40 on the H1 chart, with the long-term MA-200 providing support at $266.21. Immediate resistance stands at the Ichimoku Kijun level of $302.39. Among indicators, MACD shows a strong sell signal, ADX is at sell, and BBP is oversold, underscoring dominant seller momentum. Meanwhile, RSI is at 36.98 (sell), Stoch RSI is overbought, CCI is neutral, and the Awesome Oscillator is neutral, indicating a mix of oversold and overbought readings and adding uncertainty to the intraday outlook.
Sideways bias holds as breakout risks skew to the downside
For the coming sessions, the expected trading range for AAPL is $278.39–$304.89, reflecting the typical volatility band relative to current levels. The probability of an upward breakout stands at 21%, while the likelihood of a move lower is 79%, with the baseline scenario favoring ongoing sideways movement between these boundaries. A clear bullish scenario requires a push above $302.39 resistance to trigger renewed buying, whereas a decisive breakdown below $278.39 could open the door to further downside pressure.
Earlier, analysts noted that Apple's recent pullback was driven largely by investor skepticism regarding the company's AI rollout, despite its strong underlying fundamentals. In light of the current mix of solid earnings and technical seller momentum, traders should closely monitor price action near $278.39 for potential downside risk, as a breakdown below this level could signal further weakness ahead.


Latest Apple News


-
 Afghanistan
-
 Albania
-
 Algeria
-
 Angola
-
 Argentina
-
 Armenia
-
 Australia
-
 Austria
-
 Azerbaijan
-
 Bahamas
-
 Bahrain
-
 Bangladesh
-
 Belarus
-
 Belgium
-
 Bolivia
-
 Botswana
-
 Brazil
-
 Brunei
-
 Bulgaria
-
 Cambodia
-
 Cameroon
-
 Canada
-
 Chile
Chile
-
 China
China
-
 Colombia
-
 Congo
Congo
-
 Costa Rica
-
 Cote d'Ivoire
-
 Croatia
-
 Cuba
Cuba
-
 Cyprus
-
 Czechia
-
 DR Congo
-
 Denmark
-
 Dominican Republic
-
 Ecuador
-
 Egypt
Egypt
-
 El Salvador
-
 Estonia
-
 Eswatini
-
 Ethiopia
-
 Finland
-
 France
-
 Georgia
-
 Germany
-
 Ghana
Ghana
-
 Greece
-
 Haiti
Haiti
-
 Hong Kong
-
 Hungary
-
 India
India
-
 Indonesia
-
 Iran, Islamic republic
-
 Iraq
Iraq
-
 Ireland
-
 Israel
-
 Italy
Italy
-
 Jamaica
-
 Japan
Japan
-
 Jordan
-
 Kazakhstan
-
 Kenya
Kenya
-
 Korea
Korea
-
 Kuwait
-
 Kyrgyzstan
-
 Laos
Laos
-
 Latvia
-
 Lebanon
-
 Lesotho
-
 Libya
Libya
-
 Lithuania
-
 Luxembourg
-
 Madagascar
-
 Malaysia
-
 Malta
Malta
-
 Mauritius
-
 Mexico
-
 Moldova
-
 Mongolia
-
 Montenegro
-
 Morocco
-
 Mozambique
-
 Myanmar
-
 Namibia
-
 Nepal
Nepal
-
 Netherlands
-
 New Zealand
-
 Nigeria
-
 North Macedonia
-
 Norway
-
 Oman
Oman
-
 Pakistan
-
 Palestine
-
 Panama
-
 Papua New Guinea
-
 Paraguay
-
 Peru
Peru
-
 Philippines
-
 Poland
-
 Portugal
-
 Puerto Rico
-
 Qatar
Qatar
-
 Reunion
-
 Romania
-
 Rwanda
-
 Saudi Arabia
-
 Serbia
-
 Singapore
-
 Slovakia
-
 Slovenia
-
 Somalia
-
 South Africa
-
 Spain
Spain
-
 Sri Lanka
-
 Sweden
-
 Switzerland
-
 Syria
Syria
-
 Taiwan
-
 Tajikistan
-
 Tanzania
-
 Thailand
-
 Trinidad and Tobago
-
 Tunisia
-
 Turkey
-
 UAE
UAE
-
 Uganda
-
 Ukraine
-
 United Kingdom
-
United States
-
 Uruguay
-
 Uzbekistan
-
 Venezuela
-
 Vietnam
-
 Yemen
Yemen
-
 Zambia
-
 Zimbabwe
- Forex
- Crypto
