
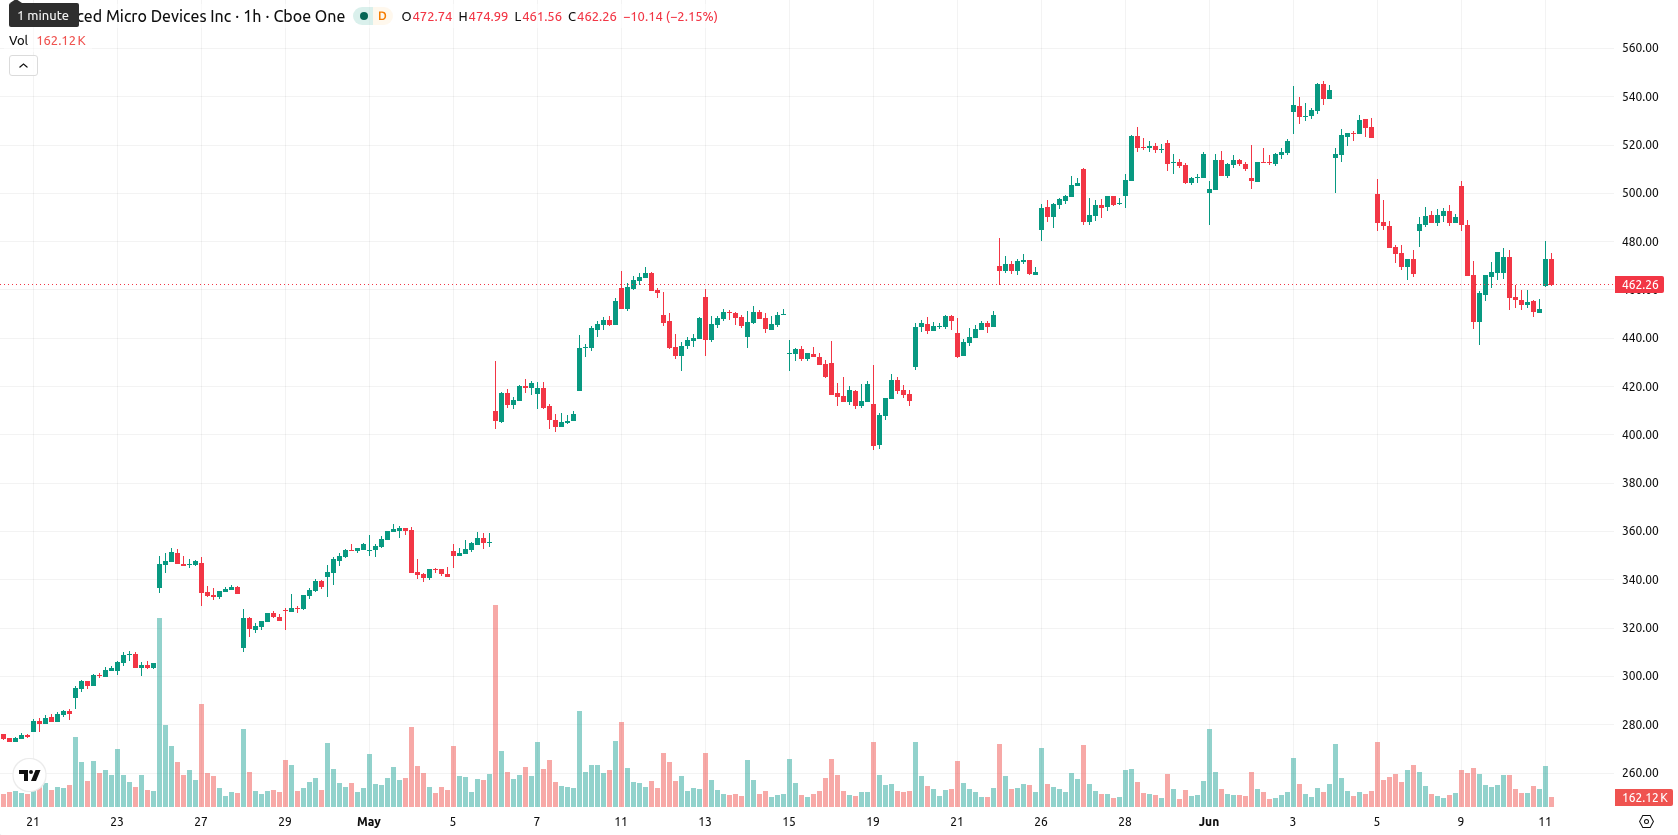
AMD stock jumps 5.64% as sellers drive sharp opening drop

Advanced Micro Devices, Inc. (AMD) stock is trading at $470.97, up 5.64% for the day. The stock sits between its short- and medium-term moving averages, highlighting mixed momentum.
Highlights
- AMD's price action shows mixed momentum, trading above short-term but below medium-term averages with recent volatility.
- Bearish momentum indicators outweigh bullish signals, with oscillators suggesting oversold conditions and fading upward momentum.
- AMD is expected to remain range-bound between $440.46 and $501.28 in the next 2–3 days, with a modest downside bias.
Diverging oscillator signals as price lingers below resistance
On the H1 timeframe, AMD trades above the MA-20 at $467.35 but remains below the MA-50 at $492.20. The long-term MA-200 sits much lower at $250.53, and the Ichimoku Kijun at $471.12 acts as immediate resistance. Among momentum indicators, the RSI is at 32.93, signaling a Sell, while both the MACD and Stoch RSI also indicate Sell. The ADX is Neutral, the CCI is showing Oversold, BBP points to seller dominance, and the Awesome Oscillator is Neutral. AMD opened with a sharp $32.88 gap but is now trading near its session low amid moderate volatility. This mix highlights that oscillator signals diverge from the earlier bullish price action, reflecting a recent loss of upward strength.
Downside risk persists as range-bound outlook dominates
Looking ahead 2–3 trading days, AMD is expected to fluctuate between $440.46 and $501.28, consistent with its typical volatility band relative to current levels. The probability leans slightly toward further decline (52%) over a rebound (48%), suggesting a range-bound environment with downside risk marginally elevated. A breakout above the $471.12 Kijun resistance could enable renewed upside momentum, while closing below key supports may accelerate losses toward the lower end of the projected range.
Earlier, analysts noted that heightened concentration and investor anxiety in AI-related stocks, including AMD, had made the sector particularly vulnerable to sharp corrections. With momentum signals now diverging and downside risk marginally elevated, monitoring AMD's behavior at the $471.12 Kijun resistance could prove pivotal for anticipating the next directional move.


Latest AMD News


-
 Afghanistan
-
 Albania
-
 Algeria
-
 Angola
-
 Argentina
-
 Armenia
-
 Australia
-
 Austria
-
 Azerbaijan
-
 Bahamas
-
 Bahrain
-
 Bangladesh
-
 Belarus
-
 Belgium
-
 Bolivia
-
 Botswana
-
 Brazil
-
 Brunei
-
 Bulgaria
-
 Cambodia
-
 Cameroon
-
 Canada
-
 Chile
Chile
-
 China
China
-
 Colombia
-
 Congo
Congo
-
 Costa Rica
-
 Cote d'Ivoire
-
 Croatia
-
 Cuba
Cuba
-
 Cyprus
-
 Czechia
-
 DR Congo
-
 Denmark
-
 Dominican Republic
-
 Ecuador
-
 Egypt
Egypt
-
 El Salvador
-
 Estonia
-
 Eswatini
-
 Ethiopia
-
 Finland
-
 France
-
 Georgia
-
 Germany
-
 Ghana
Ghana
-
 Greece
-
 Haiti
Haiti
-
 Hong Kong
-
 Hungary
-
 India
India
-
 Indonesia
-
 Iran, Islamic republic
-
 Iraq
Iraq
-
 Ireland
-
 Israel
-
 Italy
Italy
-
 Jamaica
-
 Japan
Japan
-
 Jordan
-
 Kazakhstan
-
 Kenya
Kenya
-
 Korea
Korea
-
 Kuwait
-
 Kyrgyzstan
-
 Laos
Laos
-
 Latvia
-
 Lebanon
-
 Lesotho
-
 Libya
Libya
-
 Lithuania
-
 Luxembourg
-
 Madagascar
-
 Malaysia
-
 Malta
Malta
-
 Mauritius
-
 Mexico
-
 Moldova
-
 Mongolia
-
 Montenegro
-
 Morocco
-
 Mozambique
-
 Myanmar
-
 Namibia
-
 Nepal
Nepal
-
 Netherlands
-
 New Zealand
-
 Nigeria
-
 North Macedonia
-
 Norway
-
 Oman
Oman
-
 Pakistan
-
 Palestine
-
 Panama
-
 Papua New Guinea
-
 Paraguay
-
 Peru
Peru
-
 Philippines
-
 Poland
-
 Portugal
-
 Puerto Rico
-
 Qatar
Qatar
-
 Reunion
-
 Romania
-
 Rwanda
-
 Saudi Arabia
-
 Serbia
-
 Singapore
-
 Slovakia
-
 Slovenia
-
 Somalia
-
 South Africa
-
 Spain
Spain
-
 Sri Lanka
-
 Sweden
-
 Switzerland
-
 Syria
Syria
-
 Taiwan
-
 Tajikistan
-
 Tanzania
-
 Thailand
-
 Trinidad and Tobago
-
 Tunisia
-
 Turkey
-
 UAE
UAE
-
 Uganda
-
 Ukraine
-
 United Kingdom
-
United States
-
 Uruguay
-
 Uzbekistan
-
 Venezuela
-
 Vietnam
-
 Yemen
Yemen
-
 Zambia
-
 Zimbabwe
- Forex
- Crypto
