
Qualcomm stock gains as oversold signals help curb recent declines

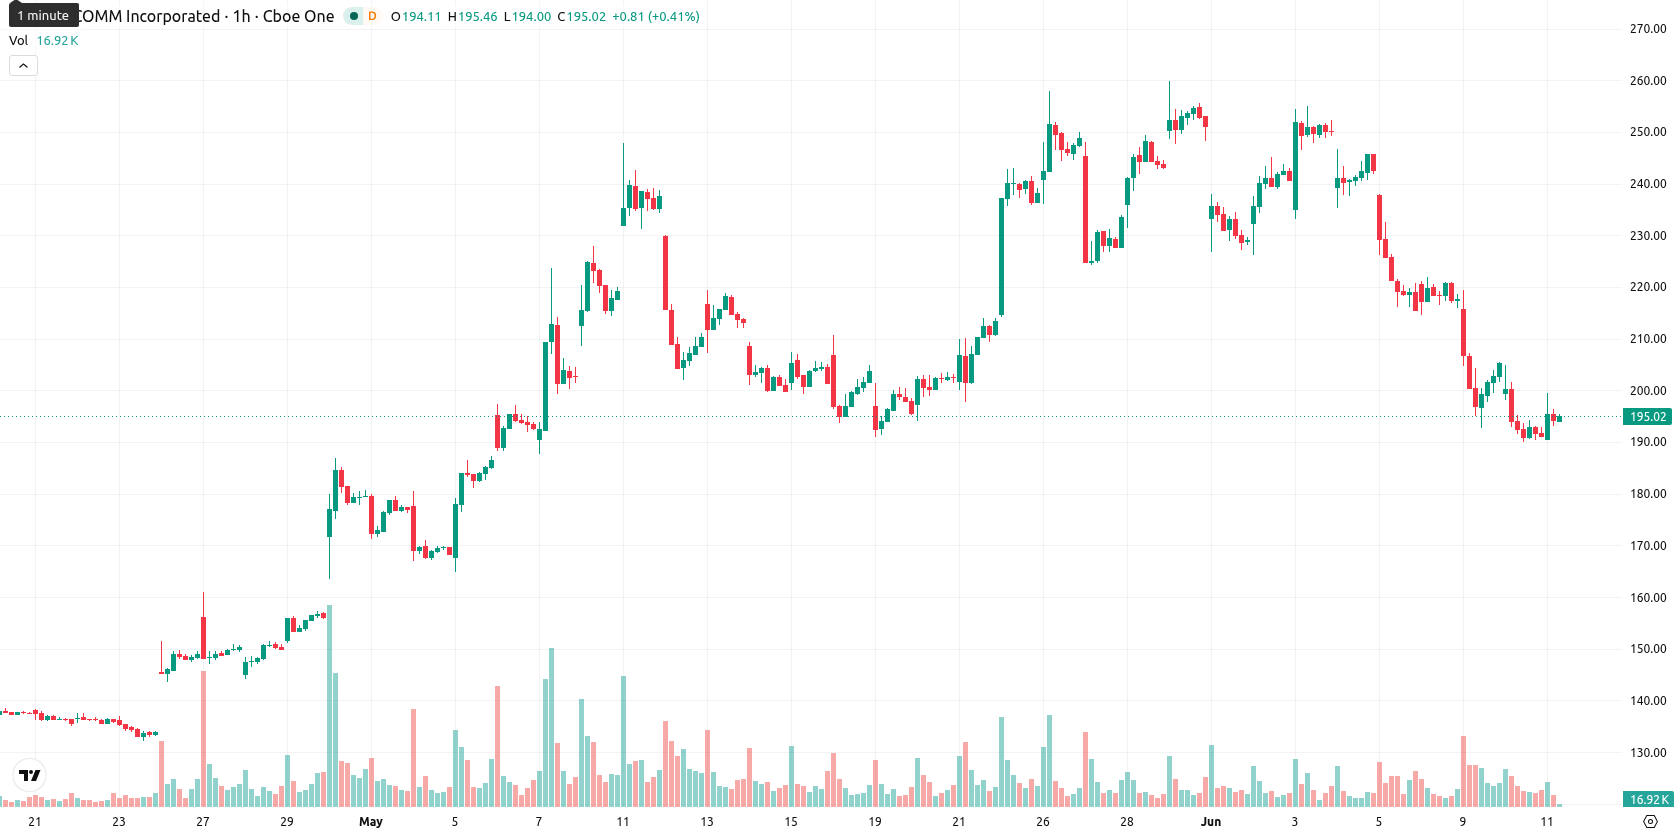
Qualcomm Incorporated (QCOM) stock is trading at $194.23, up 2.13% today. The shares have rebounded on the session, now positioned below key short- and medium-term moving averages while still sitting above their long-term trend mark.
Highlights
- Qualcomm reported $10.6 billion in revenue and non-GAAP EPS of $2.65, impacted by a 13% handset revenue decline due to memory supply constraints and weaker Chinese demand.
- Institutional activity was mixed, with Saturna Capital cutting positions by 11% while Fox Run Management initiated new exposure, underscoring uncertain investor sentiment.
- Bearish momentum prevails as QCOM trades below short-term moving averages, with a projected price range of $175.33 to $213.13 and a high probability of further downside.
Mixed sentiment as handset revenue drop weighs on flows
Qualcomm’s recent earnings report revealed $10.6 billion in revenue and non-GAAP diluted EPS of $2.65 for the second fiscal quarter of 2026, with performance hampered by a 13% drop in handset revenue due to persistent memory supply constraints and subdued demand from Chinese handset makers. These supply-driven challenges have created headwinds for near-term earnings momentum, but the underlying revenue base remains robust. Additionally, institutional flows have seen Saturna Capital Corp reduce its Qualcomm exposure by 11% in the fourth quarter, while Fox Run Management L.L.C. established a new position, reflecting mixed sentiment among major holders.
Bearish momentum confirmed as key resistance and oversold signals converge
On the hourly chart, QCOM is below both the MA-20 and MA-50, but remains above the daily MA-200, highlighting clear technical boundaries. The Ichimoku Kijun on the daily timeframe sits at $206.02, now acting as immediate resistance. Additional technical signals point to bearish momentum: the MACD is rated Strong Sell, ADX indicates a Sell, and both the RSI and CCI flag oversold conditions. Stoch RSI is notably overbought, presenting a divergence, while BBP is firmly in oversold territory and the Awesome Oscillator is neutral, collectively reflecting intraday selling pressure and market indecision at session close.
Downside favored as narrow volatility band limits bullish prospects
For the next 2–3 trading days, QCOM is likely to trade within a volatility band between $175.33 and $213.13. The probability of a significant upward correction remains low, with downside risk strongly favored. The baseline scenario is for the stock to move sideways inside this range; a sustained break above $206.02 would indicate a bullish reversal, while a move below $175.33 may trigger accelerated selling.
Earlier, analysts noted that Qualcomm faced persistent short-term selling pressure despite supportive long-term fundamentals and positive sentiment around its strategic initiatives. With downside risk currently dominating and momentum indicators signaling continued uncertainty, traders should closely monitor for a decisive move beyond $206.02 or below $175.33 as the next directional trigger.


-
 Afghanistan
-
 Albania
-
 Algeria
-
 Angola
-
 Argentina
-
 Armenia
-
 Australia
-
 Austria
-
 Azerbaijan
-
 Bahamas
-
 Bahrain
-
 Bangladesh
-
 Belarus
-
 Belgium
-
 Bolivia
-
 Botswana
-
 Brazil
-
 Brunei
-
 Bulgaria
-
 Cambodia
-
 Cameroon
-
 Canada
-
 Chile
Chile
-
 China
China
-
 Colombia
-
 Congo
Congo
-
 Costa Rica
-
 Cote d'Ivoire
-
 Croatia
-
 Cuba
Cuba
-
 Cyprus
-
 Czechia
-
 DR Congo
-
 Denmark
-
 Dominican Republic
-
 Ecuador
-
 Egypt
Egypt
-
 El Salvador
-
 Estonia
-
 Eswatini
-
 Ethiopia
-
 Finland
-
 France
-
 Georgia
-
 Germany
-
 Ghana
Ghana
-
 Greece
-
 Haiti
Haiti
-
 Hong Kong
-
 Hungary
-
 India
India
-
 Indonesia
-
 Iran, Islamic republic
-
 Iraq
Iraq
-
 Ireland
-
 Israel
-
 Italy
Italy
-
 Jamaica
-
 Japan
Japan
-
 Jordan
-
 Kazakhstan
-
 Kenya
Kenya
-
 Korea
Korea
-
 Kuwait
-
 Kyrgyzstan
-
 Laos
Laos
-
 Latvia
-
 Lebanon
-
 Lesotho
-
 Libya
Libya
-
 Lithuania
-
 Luxembourg
-
 Madagascar
-
 Malaysia
-
 Malta
Malta
-
 Mauritius
-
 Mexico
-
 Moldova
-
 Mongolia
-
 Montenegro
-
 Morocco
-
 Mozambique
-
 Myanmar
-
 Namibia
-
 Nepal
Nepal
-
 Netherlands
-
 New Zealand
-
 Nigeria
-
 North Macedonia
-
 Norway
-
 Oman
Oman
-
 Pakistan
-
 Palestine
-
 Panama
-
 Papua New Guinea
-
 Paraguay
-
 Peru
Peru
-
 Philippines
-
 Poland
-
 Portugal
-
 Puerto Rico
-
 Qatar
Qatar
-
 Reunion
-
 Romania
-
 Rwanda
-
 Saudi Arabia
-
 Serbia
-
 Singapore
-
 Slovakia
-
 Slovenia
-
 Somalia
-
 South Africa
-
 Spain
Spain
-
 Sri Lanka
-
 Sweden
-
 Switzerland
-
 Syria
Syria
-
 Taiwan
-
 Tajikistan
-
 Tanzania
-
 Thailand
-
 Trinidad and Tobago
-
 Tunisia
-
 Turkey
-
 UAE
UAE
-
 Uganda
-
 Ukraine
-
 United Kingdom
-
United States
-
 Uruguay
-
 Uzbekistan
-
 Venezuela
-
 Vietnam
-
 Yemen
Yemen
-
 Zambia
-
 Zimbabwe
- Forex
- Crypto
