
CleanSpark stock price forecast: $15.65 resistance in focus as CLSK rises 3.22%

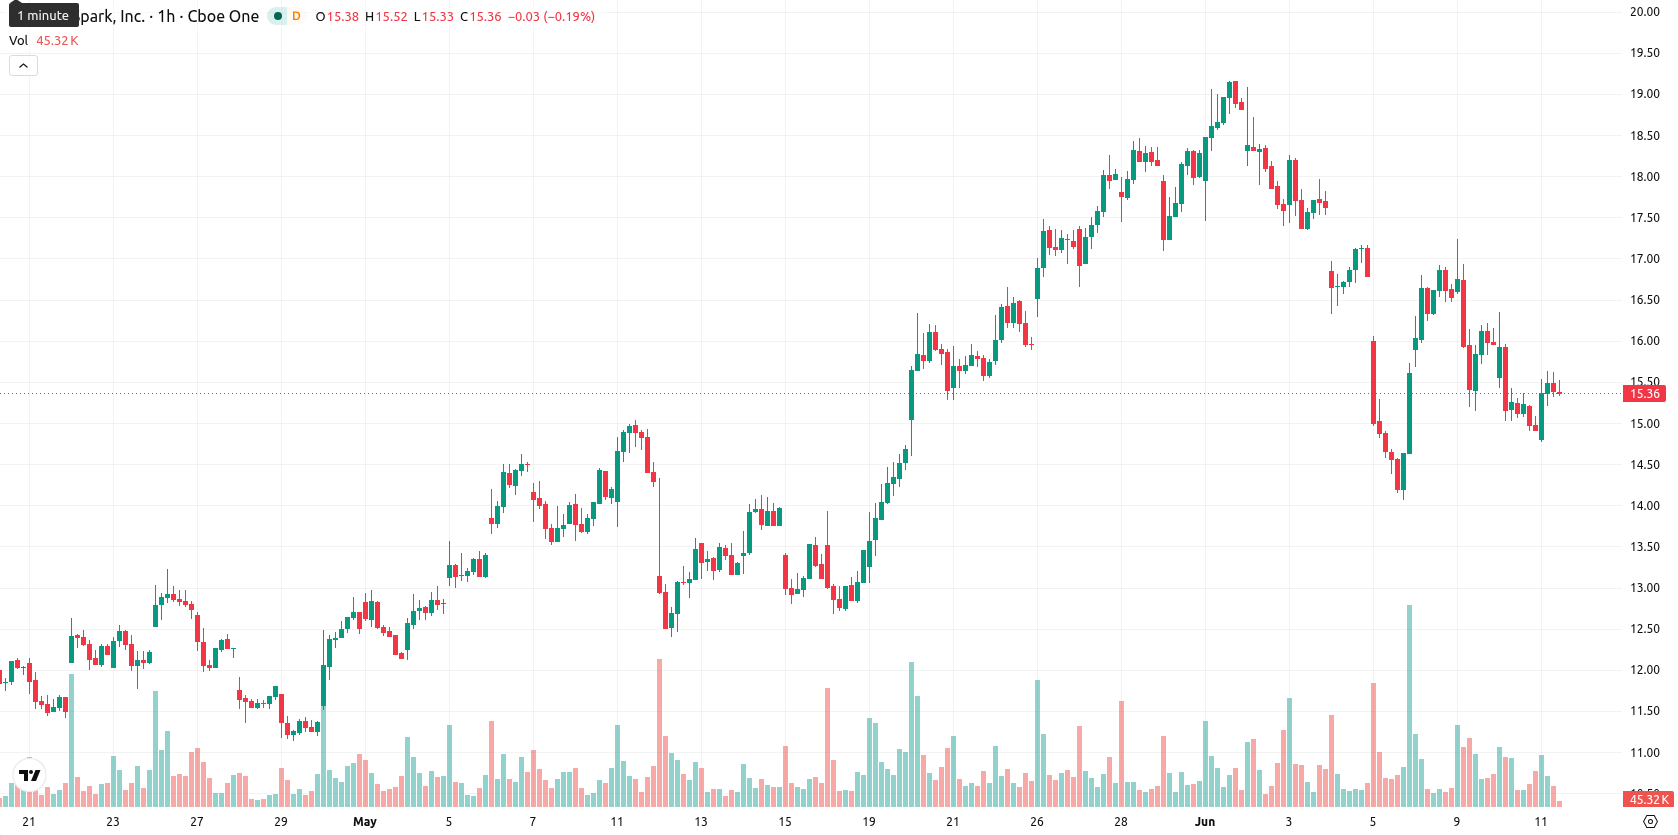
CleanSpark (CLSK) stock is trading at $15.38, up 3.22% for the day. The price currently sits below its key short- and medium-term moving averages but remains positioned above its long-term averages.
Highlights
- CleanSpark mined 671 Bitcoin in May 2026, sustaining reliable production and signaling operational consistency amid sector volatility.
- The company is advancing a potential Sandersville site lease to a major technology firm, targeting diversified revenue from AI infrastructure.
- CLSK trades below key short- and medium-term moving averages, with high volatility and a projected range of $13.96 to $16.80, favoring downside continuation.
Operational stability offsets loss as AI partnership signals revenue shift
CleanSpark's latest operating update shows the company produced 671 Bitcoin in May 2026, with an average daily output of 21.66 and a single-day peak of 23.16, demonstrating steady mining capacity and execution. These figures reinforce operational reliability, which attracts investor interest as the company demonstrates its ability to sustain production at scale. Alongside this, CleanSpark is negotiating to lease part of its Sandersville site to a major technology company for high-performance computing, introducing the prospect of diversified revenues linked to AI infrastructure. The period's reported net loss of $757 million, while highlighting profitability challenges, is balanced by operational developments that may support longer-term financial resilience.
Short-term bearish momentum contrasted by long-term support and volatility
On the hourly timeframe, CLSK is trading below the MA-20 at $15.74 and the MA-50 at $16.31, while on the daily chart it remains above the MA-200 at $12.83. The Ichimoku Kijun sits at $15.65 and marks immediate resistance. Momentum indicators present a mixed outlook: the MACD suggests strong selling pressure, while the ADX is neutral, indicating little trend conviction. The RSI stands at 44.29, aligning with a Sell signal, whereas Stoch RSI and CCI show neutral signals, reflecting an absence of overbought or oversold conditions. BBP points to intraday buyer dominance and elevated price volatility, with the price near today's high, underlining a divergence between short-term momentum and session strength.
Downside risk prevails as volatility range signals consolidation
Looking ahead, the typical volatility range for CLSK over the next several sessions is forecast between $13.96 and $16.80. There is a 39% probability of a move higher and a 61% likelihood of a downward shift, placing baseline expectations in a sideways consolidation within the defined band. An upward scenario would require a break above immediate resistance at $15.65, while increased downside risk would be triggered if the price closes below support near $13.96.
Previously it was reported that CleanSpark exhibited persistent selling pressure but maintained an overall bullish medium- to long-term technical structure. With new operational updates and diversification efforts now underway, market participants should monitor for potential volatility spikes if the stock tests or breaks below its current long-term support, as this would signal a meaningful shift from the prior outlook.


Latest CleanSpark News


-
 Afghanistan
-
 Albania
-
 Algeria
-
 Angola
-
 Argentina
-
 Armenia
-
 Australia
-
 Austria
-
 Azerbaijan
-
 Bahamas
-
 Bahrain
-
 Bangladesh
-
 Belarus
-
 Belgium
-
 Bolivia
-
 Botswana
-
 Brazil
-
 Brunei
-
 Bulgaria
-
 Cambodia
-
 Cameroon
-
 Canada
-
 Chile
Chile
-
 China
China
-
 Colombia
-
 Congo
Congo
-
 Costa Rica
-
 Cote d'Ivoire
-
 Croatia
-
 Cuba
Cuba
-
 Cyprus
-
 Czechia
-
 DR Congo
-
 Denmark
-
 Dominican Republic
-
 Ecuador
-
 Egypt
Egypt
-
 El Salvador
-
 Estonia
-
 Eswatini
-
 Ethiopia
-
 Finland
-
 France
-
 Georgia
-
 Germany
-
 Ghana
Ghana
-
 Greece
-
 Haiti
Haiti
-
 Hong Kong
-
 Hungary
-
 India
India
-
 Indonesia
-
 Iran, Islamic republic
-
 Iraq
Iraq
-
 Ireland
-
 Israel
-
 Italy
Italy
-
 Jamaica
-
 Japan
Japan
-
 Jordan
-
 Kazakhstan
-
 Kenya
Kenya
-
 Korea
Korea
-
 Kuwait
-
 Kyrgyzstan
-
 Laos
Laos
-
 Latvia
-
 Lebanon
-
 Lesotho
-
 Libya
Libya
-
 Lithuania
-
 Luxembourg
-
 Madagascar
-
 Malaysia
-
 Malta
Malta
-
 Mauritius
-
 Mexico
-
 Moldova
-
 Mongolia
-
 Montenegro
-
 Morocco
-
 Mozambique
-
 Myanmar
-
 Namibia
-
 Nepal
Nepal
-
 Netherlands
-
 New Zealand
-
 Nigeria
-
 North Macedonia
-
 Norway
-
 Oman
Oman
-
 Pakistan
-
 Palestine
-
 Panama
-
 Papua New Guinea
-
 Paraguay
-
 Peru
Peru
-
 Philippines
-
 Poland
-
 Portugal
-
 Puerto Rico
-
 Qatar
Qatar
-
 Reunion
-
 Romania
-
 Rwanda
-
 Saudi Arabia
-
 Serbia
-
 Singapore
-
 Slovakia
-
 Slovenia
-
 Somalia
-
 South Africa
-
 Spain
Spain
-
 Sri Lanka
-
 Sweden
-
 Switzerland
-
 Syria
Syria
-
 Taiwan
-
 Tajikistan
-
 Tanzania
-
 Thailand
-
 Trinidad and Tobago
-
 Tunisia
-
 Turkey
-
 UAE
UAE
-
 Uganda
-
 Ukraine
-
 United Kingdom
-
United States
-
 Uruguay
-
 Uzbekistan
-
 Venezuela
-
 Vietnam
-
 Yemen
Yemen
-
 Zambia
-
 Zimbabwe
- Forex
- Crypto
