
Nvidia stock trades above key moving averages with robust buyer activity: weekly review

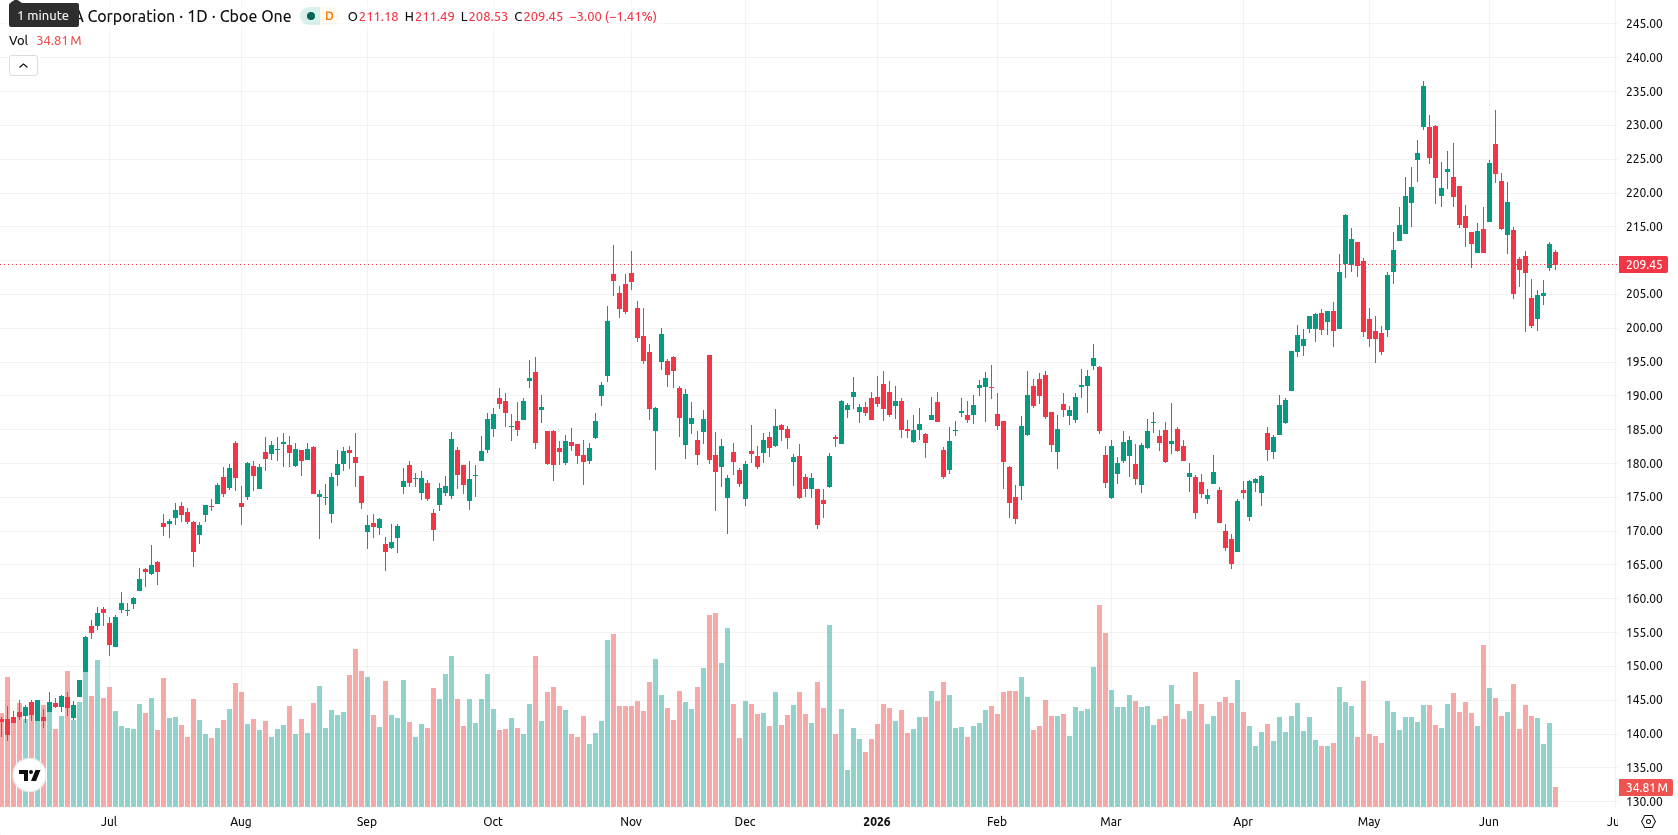
NVIDIA Corporation (NVDA) closed the week at $209.29, advancing $3.99 (2.09%) over the last 7 trading days and finishing in the upper zone of its weekly price range. The stock remains firmly above its major W1 moving averages — MA-20 at $194.90, MA-50 at $186.83, and MA-200 at $102.99 — confirming a structurally strong, bullish trend.
Highlights
- Nvidia maintains a strong bullish structure, with price sustaining above key medium- and long-term support levels.
- Technical momentum remains firmly positive, as all major indicators register in 'Buy' or 'Overbought' territory, supporting further upside.
- The stock is expected to consolidate between $206 and $213, with upward moves above $213 likely to trigger accelerated gains.
Robust bond demand drives positive sentiment amid AI investment plans
Nvidia completed its first corporate bond issuance in five years, raising $25 billion through a multi-tranche, investment-grade offering finalized on June 15, 2026. The bond sale featured strong investor demand, with total orders exceeding $85 billion, and spans maturities from 2 to 30 years. The funds will be used for general corporate purposes, including refinancing debt and funding AI infrastructure and data center investments.
Technical momentum accelerates as oscillators reach overbought territory
On the weekly chart, NVDA remains securely above key moving averages, with dynamic support clustered around the MA-20 at $194.90 and Ichimoku Kijun at $200.41. Momentum indicators remain firmly in 'Buy' or 'Overbought' zones: weekly RSI, CCI, and Stochastic RSI all register strong upward sentiment, while the MACD and ADX confirm ongoing trend strength. Bull/Bear Power also points to dominant buyer activity, supporting a robust technical backdrop, though heightened oscillator readings hint at the possibility of near-term pullbacks or consolidation.
Range-bound outlook favored as strong trend supports upside risks
For the next 7 trading days, NVDA is expected to trade between $205.69 and $213.12, with an estimated average near $209.40. Based on the current alignment of W1 trend and momentum indicators, there is a very high probability (over 80%) of continued upward movement, with all four major signals in 'Buy' or 'Strong Buy'. The baseline scenario anticipates consolidation within the $206 – $213 range. A bullish breakout above $213.12 could accelerate gains, while a break below $205.69 may trigger a short-term correction into the $195 – $200 dynamic support zone.
Earlier, analysts noted Nvidia’s resilience amid mixed short-term momentum and its strategic focus on growth following a major bond issuance. The current landscape strengthens this view, with dominant buyer activity suggesting that traders should monitor the potential for a bullish breakout above $213.12 in the coming sessions.


Latest NVDA News


-
 Afghanistan
-
 Albania
-
 Algeria
-
 Angola
-
 Argentina
-
 Armenia
-
 Australia
-
 Austria
-
 Azerbaijan
-
 Bahamas
-
 Bahrain
-
 Bangladesh
-
 Belarus
-
 Belgium
-
 Bolivia
-
 Botswana
-
 Brazil
-
 Brunei
-
 Bulgaria
-
 Cambodia
-
 Cameroon
-
 Canada
-
 Chile
Chile
-
 China
China
-
 Colombia
-
 Congo
Congo
-
 Costa Rica
-
 Cote d'Ivoire
-
 Croatia
-
 Cuba
Cuba
-
 Cyprus
-
 Czechia
-
 DR Congo
-
 Denmark
-
 Dominican Republic
-
 Ecuador
-
 Egypt
Egypt
-
 El Salvador
-
 Estonia
-
 Eswatini
-
 Ethiopia
-
 Finland
-
 France
-
 Georgia
-
 Germany
-
 Ghana
Ghana
-
 Greece
-
 Haiti
Haiti
-
 Hong Kong
-
 Hungary
-
 India
India
-
 Indonesia
-
 Iran, Islamic republic
-
 Iraq
Iraq
-
 Ireland
-
 Israel
-
 Italy
Italy
-
 Jamaica
-
 Japan
Japan
-
 Jordan
-
 Kazakhstan
-
 Kenya
Kenya
-
 Korea
Korea
-
 Kuwait
-
 Kyrgyzstan
-
 Laos
Laos
-
 Latvia
-
 Lebanon
-
 Lesotho
-
 Libya
Libya
-
 Lithuania
-
 Luxembourg
-
 Madagascar
-
 Malaysia
-
 Malta
Malta
-
 Mauritius
-
 Mexico
-
 Moldova
-
 Mongolia
-
 Montenegro
-
 Morocco
-
 Mozambique
-
 Myanmar
-
 Namibia
-
 Nepal
Nepal
-
 Netherlands
-
 New Zealand
-
 Nigeria
-
 North Macedonia
-
 Norway
-
 Oman
Oman
-
 Pakistan
-
 Palestine
-
 Panama
-
 Papua New Guinea
-
 Paraguay
-
 Peru
Peru
-
 Philippines
-
 Poland
-
 Portugal
-
 Puerto Rico
-
 Qatar
Qatar
-
 Reunion
-
 Romania
-
 Rwanda
-
 Saudi Arabia
-
 Serbia
-
 Singapore
-
 Slovakia
-
 Slovenia
-
 Somalia
-
 South Africa
-
 Spain
Spain
-
 Sri Lanka
-
 Sweden
-
 Switzerland
-
 Syria
Syria
-
 Taiwan
-
 Tajikistan
-
 Tanzania
-
 Thailand
-
 Trinidad and Tobago
-
 Tunisia
-
 Turkey
-
 UAE
UAE
-
 Uganda
-
 Ukraine
-
 United Kingdom
-
United States
-
 Uruguay
-
 Uzbekistan
-
 Venezuela
-
 Vietnam
-
 Yemen
Yemen
-
 Zambia
-
 Zimbabwe
- Forex
- Crypto
