
AST SpaceMobile stock gains with buyers and sellers showing uncertainty around key resistance

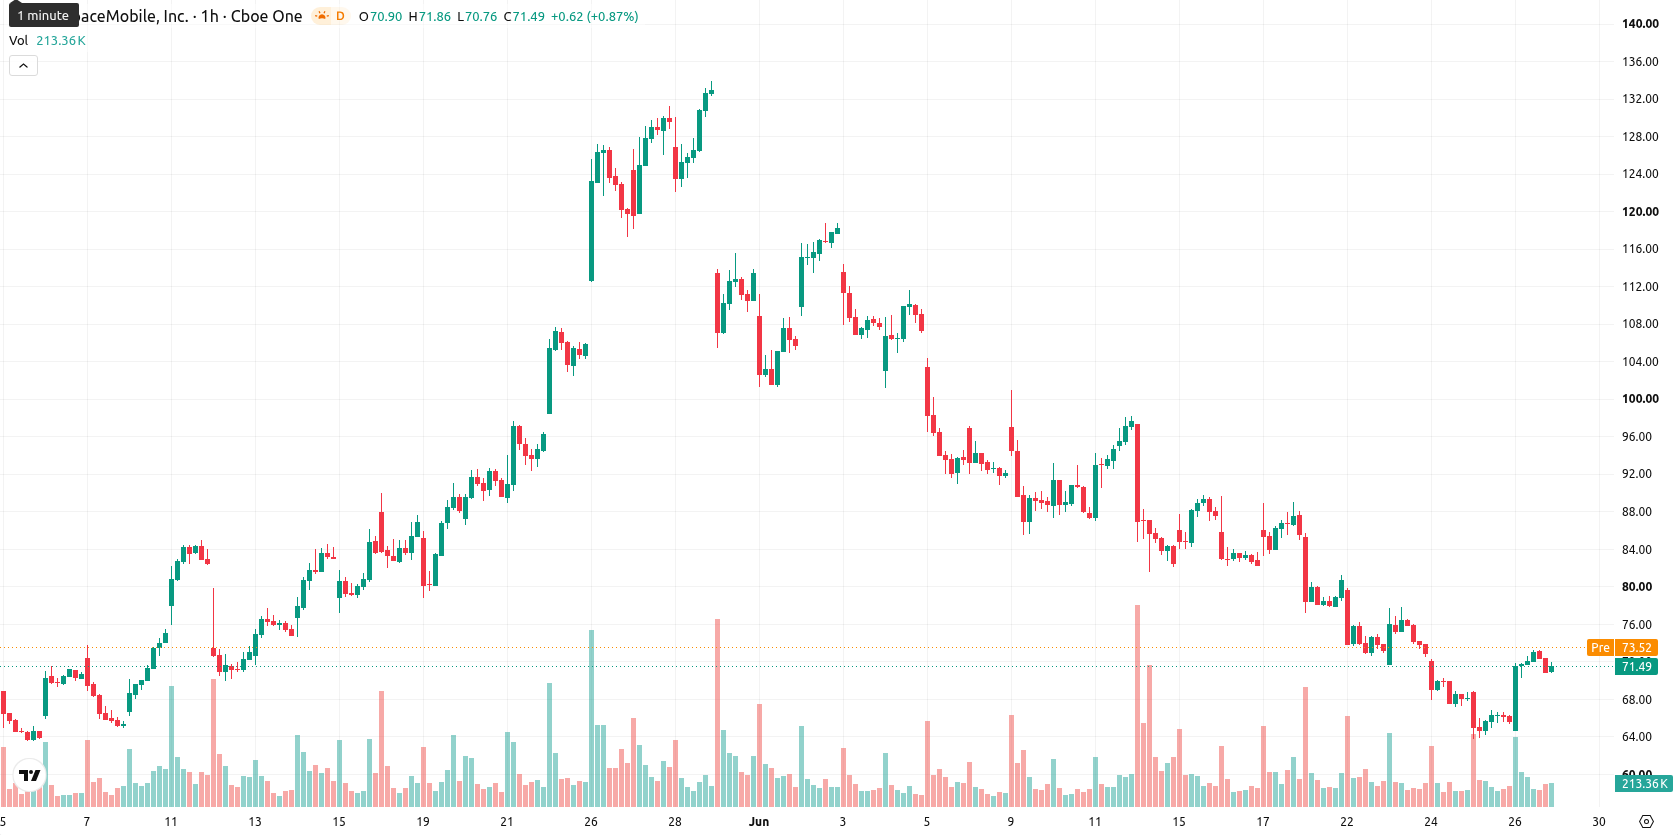
AST SpaceMobile (ASTS) stock is trading at $71.45 after jumping 8.88% today. The price sits above its key short-term moving average while remaining below medium- and long-term trend levels.
Highlights
- ASTS/USD shows mixed short- and medium-term trends, trading above the short-term average but below longer-term moving averages.
- Momentum indicators diverge, with some overbought signals and neutral-bullish bias, reflecting short-term strength amid volatility.
- Price is expected to move sideways in the $64.26–$78.64 corridor, with downside risk outweighing upward breakout probability.
Mixed technical signals as oscillators diverge on direction
On the technical side, ASTS is trading above its 20-day moving average, but remains under both the 50-day and 200-day moving averages, with the Ichimoku Kijun at $70.76 providing immediate support. Momentum indicators are mixed: the Moving Average Convergence Divergence (MACD) and Average Directional Index (ADX) both point to ongoing selling pressure. The Relative Strength Index (RSI) stands at 51.14 with a Buy signal, while both the Stochastic RSI and Bull/Bear Power indicate overbought conditions. The Commodity Channel Index (CCI) offers a Buy signal, and the Awesome Oscillator supports the current intraday upside, but there is divergence among oscillators and momentum indicators, signaling short-term uncertainty.
Sideways outlook favored as volatility constrains breakout odds
Looking ahead, ASTS is likely to trade within a corridor of $64.26 to $78.64 over the next several trading days, reflecting typical volatility for the period. The probability of an upward breakout is estimated at 39%, placing slightly greater odds on a downward move in the short term. The baseline scenario expects sideways action in the stated range, with a bullish breakout targeting the upper band, and a sustained drop below initial support likely to trigger a move toward the lower end of the forecast band.
Previously it was reported that AST SpaceMobile faced persistent technical pressure and a bearish overall trend despite positive operational developments. The latest analysis adds a more nuanced picture, as mixed momentum indicators and heightened short-term volatility suggest traders should watch for a resolution of the current indecision, with the risk of a near-term pullback if downside momentum accelerates.


Latest AST SpaceMobile News


-
 Afghanistan
-
 Albania
-
 Algeria
-
 Angola
-
 Argentina
-
 Armenia
-
 Australia
-
 Austria
-
 Azerbaijan
-
 Bahamas
-
 Bahrain
-
 Bangladesh
-
 Belarus
-
 Belgium
-
 Bolivia
-
 Botswana
-
 Brazil
-
 Brunei
-
 Bulgaria
-
 Cambodia
-
 Cameroon
-
 Canada
-
 Chile
Chile
-
 China
China
-
 Colombia
-
 Congo
Congo
-
 Costa Rica
-
 Cote d'Ivoire
-
 Croatia
-
 Cuba
Cuba
-
 Cyprus
-
 Czechia
-
 DR Congo
-
 Denmark
-
 Dominican Republic
-
 Ecuador
-
 Egypt
Egypt
-
 El Salvador
-
 Estonia
-
 Eswatini
-
 Ethiopia
-
 Finland
-
 France
-
 Georgia
-
 Germany
-
 Ghana
Ghana
-
 Greece
-
 Haiti
Haiti
-
 Hong Kong
-
 Hungary
-
 India
India
-
 Indonesia
-
 Iran, Islamic republic
-
 Iraq
Iraq
-
 Ireland
-
 Israel
-
 Italy
Italy
-
 Jamaica
-
 Japan
Japan
-
 Jordan
-
 Kazakhstan
-
 Kenya
Kenya
-
 Korea
Korea
-
 Kuwait
-
 Kyrgyzstan
-
 Laos
Laos
-
 Latvia
-
 Lebanon
-
 Lesotho
-
 Libya
Libya
-
 Lithuania
-
 Luxembourg
-
 Madagascar
-
 Malaysia
-
 Malta
Malta
-
 Mauritius
-
 Mexico
-
 Moldova
-
 Mongolia
-
 Montenegro
-
 Morocco
-
 Mozambique
-
 Myanmar
-
 Namibia
-
 Nepal
Nepal
-
 Netherlands
-
 New Zealand
-
 Nigeria
-
 North Macedonia
-
 Norway
-
 Oman
Oman
-
 Pakistan
-
 Palestine
-
 Panama
-
 Papua New Guinea
-
 Paraguay
-
 Peru
Peru
-
 Philippines
-
 Poland
-
 Portugal
-
 Puerto Rico
-
 Qatar
Qatar
-
 Reunion
-
 Romania
-
 Rwanda
-
 Saudi Arabia
-
 Serbia
-
 Singapore
-
 Slovakia
-
 Slovenia
-
 Somalia
-
 South Africa
-
 Spain
Spain
-
 Sri Lanka
-
 Sweden
-
 Switzerland
-
 Syria
Syria
-
 Taiwan
-
 Tajikistan
-
 Tanzania
-
 Thailand
-
 Trinidad and Tobago
-
 Tunisia
-
 Turkey
-
 UAE
UAE
-
 Uganda
-
 Ukraine
-
 United Kingdom
-
United States
-
 Uruguay
-
 Uzbekistan
-
 Venezuela
-
 Vietnam
-
 Yemen
Yemen
-
 Zambia
-
 Zimbabwe
- Forex
- Crypto
