
T-Mobile stock slides as legacy plans push customers toward higher-priced options

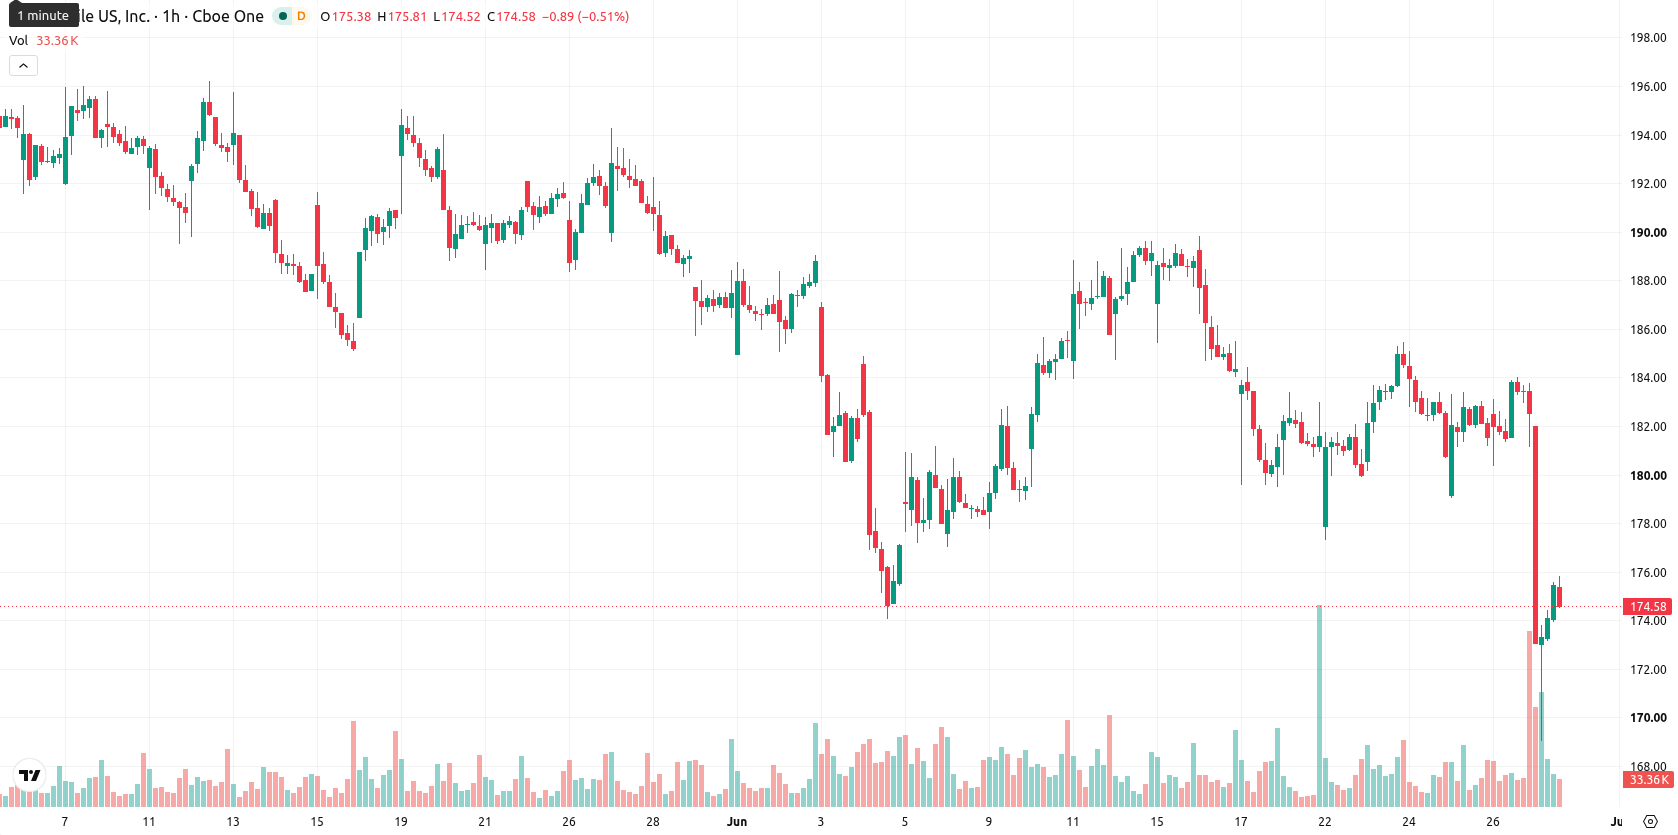
T-Mobile US, Inc. (TMUS) stock is trading at $173.83, marking a daily decline of 4.85%. The price sits below its key moving averages amid heightened volatility.
Highlights
- T-Mobile is automatically migrating legacy customers to new plans with an average $4 per line monthly price increase, aiming to boost revenues.
- Despite introducing features like enhanced international roaming and new streaming discounts, the forced plan changes risk increased churn and customer dissatisfaction.
- TMUS trades below key moving averages amid strong bearish technical signals, with expected consolidation between $160.67 and $176.98 over the next few days.
Legacy plan phaseout and price hikes spur retention concerns amid payout plan
T-Mobile has begun discontinuing a broad range of legacy phone plans, automatically migrating long-term customers to updated options that will cost an average of $4 more per line each month, according to GuruFocus. While the new plans introduce features such as improved international roaming and streaming service discounts, the forced transition is expected to generate some customer dissatisfaction and could impact subscriber retention. Additionally, T-Mobile has announced a $1.02 per share quarterly dividend to be paid in September 2026, reflecting a long-term payout strategy — though price action has remained under broader selling pressure.
Bearish momentum accelerates as oversold signals and key barriers align
On the hourly chart, TMUS is positioned below both its 20-period and 50-period moving averages, while the daily timeframe shows the price under the 200-period moving average. The Ichimoku Kijun line presents immediate resistance at $177.24. Momentum indicators reinforce the bearish backdrop: the Moving Average Convergence Divergence (MACD), Average Directional Index (ADX), and Awesome Oscillator collectively signal strong downside momentum. The Relative Strength Index (RSI) at 26.05, along with readings from the Stochastic RSI, Commodity Channel Index (CCI), and Bull/Bear Power, all suggest oversold conditions and continued seller dominance.
Downside risk intensifies as narrow rebound probability persists
Over the next 2 to 3 trading days, TMUS is expected to remain volatile, trading within a range of $160.67 to $176.98. The probability of a near-term upside move is very low, while the likelihood of further downside is high. The base case is for price to consolidate within this volatility band. Should the price break above resistance, a short-lived rebound could emerge, but if continued selling breaks below support, the risk of further losses increases.
Earlier, analysts noted that T-Mobile faced persistent selling pressure and technical weakness amid mixed momentum signals. The current escalation in customer plan changes and deepening bearish price action reinforce the downside scenario, making sustained closes beneath near-term support a key risk for further declines.


Latest T-Mobile News


-
 Afghanistan
-
 Albania
-
 Algeria
-
 Angola
-
 Argentina
-
 Armenia
-
 Australia
-
 Austria
-
 Azerbaijan
-
 Bahamas
-
 Bahrain
-
 Bangladesh
-
 Belarus
-
 Belgium
-
 Bolivia
-
 Botswana
-
 Brazil
-
 Brunei
-
 Bulgaria
-
 Cambodia
-
 Cameroon
-
 Canada
-
 Chile
Chile
-
 China
China
-
 Colombia
-
 Congo
Congo
-
 Costa Rica
-
 Cote d'Ivoire
-
 Croatia
-
 Cuba
Cuba
-
 Cyprus
-
 Czechia
-
 DR Congo
-
 Denmark
-
 Dominican Republic
-
 Ecuador
-
 Egypt
Egypt
-
 El Salvador
-
 Estonia
-
 Eswatini
-
 Ethiopia
-
 Finland
-
 France
-
 Georgia
-
 Germany
-
 Ghana
Ghana
-
 Greece
-
 Haiti
Haiti
-
 Hong Kong
-
 Hungary
-
 India
India
-
 Indonesia
-
 Iran, Islamic republic
-
 Iraq
Iraq
-
 Ireland
-
 Israel
-
 Italy
Italy
-
 Jamaica
-
 Japan
Japan
-
 Jordan
-
 Kazakhstan
-
 Kenya
Kenya
-
 Korea
Korea
-
 Kuwait
-
 Kyrgyzstan
-
 Laos
Laos
-
 Latvia
-
 Lebanon
-
 Lesotho
-
 Libya
Libya
-
 Lithuania
-
 Luxembourg
-
 Madagascar
-
 Malaysia
-
 Malta
Malta
-
 Mauritius
-
 Mexico
-
 Moldova
-
 Mongolia
-
 Montenegro
-
 Morocco
-
 Mozambique
-
 Myanmar
-
 Namibia
-
 Nepal
Nepal
-
 Netherlands
-
 New Zealand
-
 Nigeria
-
 North Macedonia
-
 Norway
-
 Oman
Oman
-
 Pakistan
-
 Palestine
-
 Panama
-
 Papua New Guinea
-
 Paraguay
-
 Peru
Peru
-
 Philippines
-
 Poland
-
 Portugal
-
 Puerto Rico
-
 Qatar
Qatar
-
 Reunion
-
 Romania
-
 Rwanda
-
 Saudi Arabia
-
 Serbia
-
 Singapore
-
 Slovakia
-
 Slovenia
-
 Somalia
-
 South Africa
-
 Spain
Spain
-
 Sri Lanka
-
 Sweden
-
 Switzerland
-
 Syria
Syria
-
 Taiwan
-
 Tajikistan
-
 Tanzania
-
 Thailand
-
 Trinidad and Tobago
-
 Tunisia
-
 Turkey
-
 UAE
UAE
-
 Uganda
-
 Ukraine
-
 United Kingdom
-
United States
-
 Uruguay
-
 Uzbekistan
-
 Venezuela
-
 Vietnam
-
 Yemen
Yemen
-
 Zambia
-
 Zimbabwe
- Forex
- Crypto
