

NVDA shares rally with price sustaining above key moving averages: weekly forecast

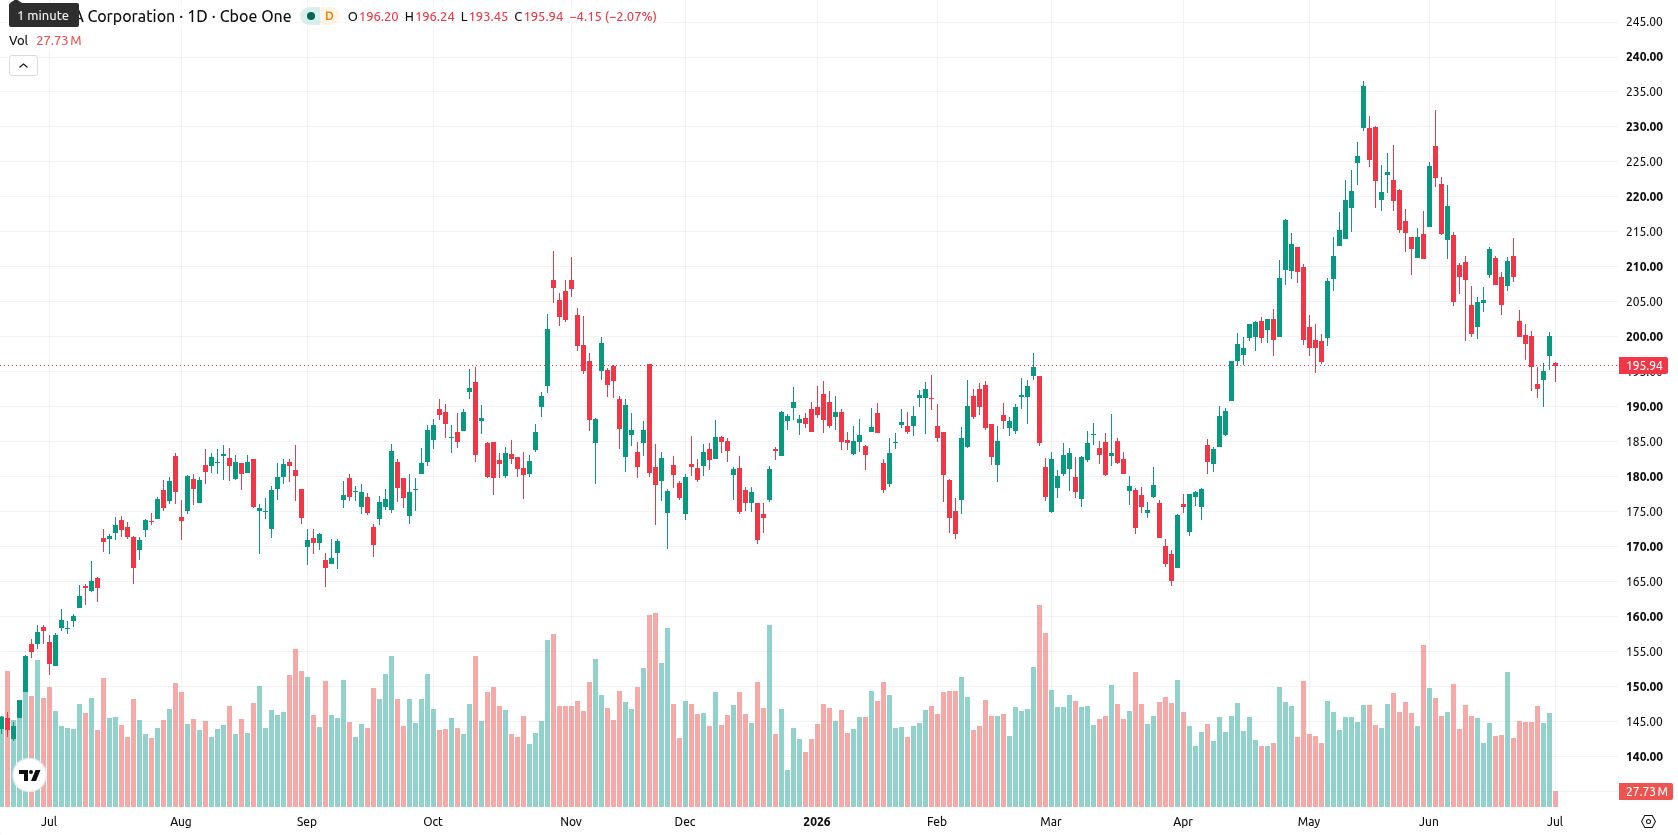
NVIDIA Corporation (NVDA) closed the week at $199.84, climbing $7.83 or 4.08% over the past seven trading days. The stock remains positioned above its weekly MA-20 ($195.98), MA-50 ($187.89), and MA-200 ($104.79), underscoring a strong bullish alignment across all major moving averages.
 225.02
239.05
225.02
239.05
Highlights
- Nvidia remains in a strong bullish technical structure, trading above all major moving averages with dynamic trend support intact.
- Momentum and trend indicators favor continued upside, but overbought oscillators and recent buyer exhaustion point to possible short-term reversal risk.
- For the coming week, Nvidia is expected to trade between $195.36 support and $213.94 resistance, with a 75% probability of an upward move.
Buyback expansion and AI launches drive positive sentiment this week
Nvidia expanded its share buyback program by $80 billion and raised its quarterly dividend to $0.25 per share, highlighting continued confidence in capital returns. The company introduced new initiatives in AI and robotics, notably launching its robotics safety toolkit and BioNeMo Agent Toolkit with leading organizations as early adopters. Nvidia also secured shareholder approval to shift from supermajority to simple majority voting structure.
Bullish technicals persist despite early exhaustion signals over the week
On the weekly (W1) chart, NVDA remains firmly atop all major moving averages, with dynamic support at the MA-50 and long-term support at the MA-200. The MACD maintains a Strong Buy signal, ADX confirms trend strength, and RSI reflects mild buying bias; however, oscillators like Stochastic RSI and Bull/Bear Power are in oversold territory, indicating early signs of buyer exhaustion. Immediate weekly support lies at $195.36 with major resistance near $213.94, and volatility registered at 6.25%.
Sideways-to-up bias seen as consolidation and breakout risk develop
For the next five trading days, the outlook is for sideways-to-upward movement between the $195.36 support and $213.94 resistance. With 75% of weekly indicators showing bullish momentum, the baseline scenario sees NVDA consolidating near current highs. A clear breakout above $213.94 could spark further rallies, while a decline below $195.36 would put the MA-20 and MA-50 supports into focus and indicate potential correction.
Earlier, analysts noted that heightened regulatory scrutiny and mixed technical momentum were contributing to increased volatility and risk in Nvidia's stock. With Nvidia now demonstrating strong alignment above all major weekly moving averages and launching substantial buybacks alongside expanding AI initiatives, traders should closely monitor the $213.94 resistance for signs of a sustained breakout in the coming sessions.











-
 Afghanistan
-
 Albania
-
 Algeria
-
 Angola
-
 Argentina
-
 Armenia
-
 Australia
-
 Austria
-
 Azerbaijan
-
 Bahamas
-
 Bahrain
-
 Bangladesh
-
 Belarus
-
 Belgium
-
 Bolivia
-
 Botswana
-
 Brazil
-
 Brunei
-
 Bulgaria
-
 Cambodia
-
 Cameroon
-
 Canada
-
 Chile
Chile
-
 China
China
-
 Colombia
-
 Congo
Congo
-
 Costa Rica
-
 Cote d'Ivoire
-
 Croatia
-
 Cuba
Cuba
-
 Cyprus
-
 Czechia
-
 DR Congo
-
 Denmark
-
 Dominican Republic
-
 Ecuador
-
 Egypt
Egypt
-
 El Salvador
-
 Estonia
-
 Eswatini
-
 Ethiopia
-
 Finland
-
 France
-
 Georgia
-
 Germany
-
 Ghana
Ghana
-
 Greece
-
 Haiti
Haiti
-
 Hong Kong
-
 Hungary
-
 India
India
-
 Indonesia
-
 Iran, Islamic republic
-
 Iraq
Iraq
-
 Ireland
-
 Israel
-
 Italy
Italy
-
 Jamaica
-
 Japan
Japan
-
 Jordan
-
 Kazakhstan
-
 Kenya
Kenya
-
 Korea
Korea
-
 Kuwait
-
 Kyrgyzstan
-
 Laos
Laos
-
 Latvia
-
 Lebanon
-
 Lesotho
-
 Libya
Libya
-
 Lithuania
-
 Luxembourg
-
 Madagascar
-
 Malaysia
-
 Malta
Malta
-
 Mauritius
-
 Mexico
-
 Moldova
-
 Mongolia
-
 Montenegro
-
 Morocco
-
 Mozambique
-
 Myanmar
-
 Namibia
-
 Nepal
Nepal
-
 Netherlands
-
 New Zealand
-
 Nigeria
-
 North Macedonia
-
 Norway
-
 Oman
Oman
-
 Pakistan
-
 Palestine
-
 Panama
-
 Papua New Guinea
-
 Paraguay
-
 Peru
Peru
-
 Philippines
-
 Poland
-
 Portugal
-
 Puerto Rico
-
 Qatar
Qatar
-
 Reunion
-
 Romania
-
 Rwanda
-
 Saudi Arabia
-
 Serbia
-
 Singapore
-
 Slovakia
-
 Slovenia
-
 Somalia
-
 South Africa
-
 Spain
Spain
-
 Sri Lanka
-
 Sweden
-
 Switzerland
-
 Syria
Syria
-
 Taiwan
-
 Tajikistan
-
 Tanzania
-
 Thailand
-
 Trinidad and Tobago
-
 Tunisia
-
 Turkey
-
 UAE
UAE
-
 Uganda
-
 Ukraine
-
 United Kingdom
-
United States
-
 Uruguay
-
 Uzbekistan
-
 Venezuela
-
 Vietnam
-
 Yemen
Yemen
-
 Zambia
-
 Zimbabwe
- Forex
- Crypto












