
Texas Instruments shares gain nearly 3% after price holds above support in mixed trend setup

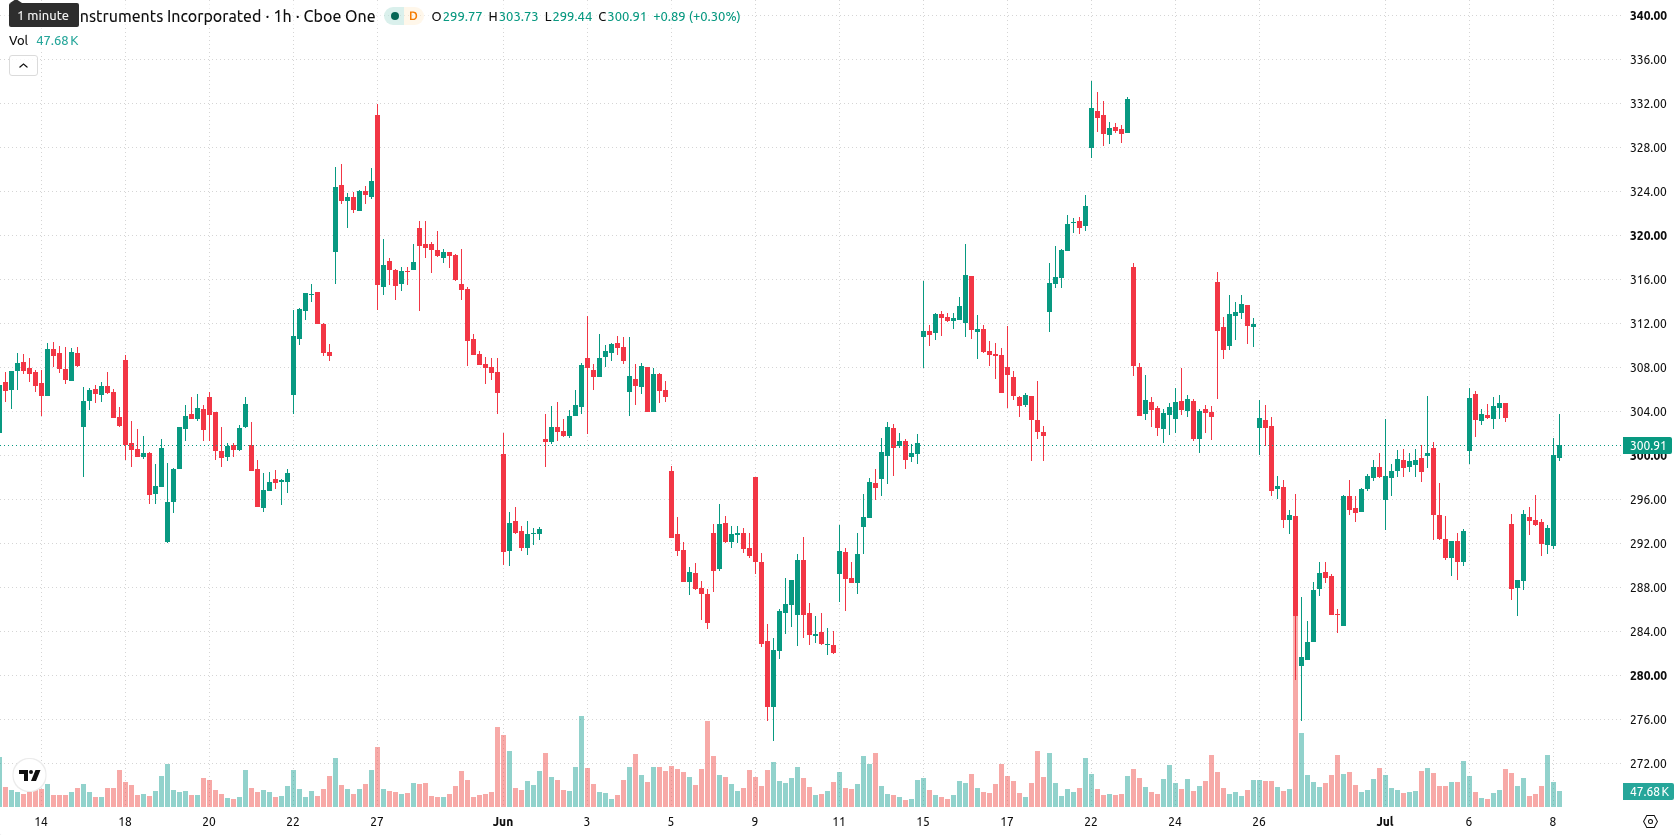
Texas Instruments (TXN) stock is trading at $301.59, up 2.81% on the day. The price stands above its key moving averages, reflecting sustained momentum.
 312.84
315.23
312.84
315.23
Highlights
- TXN/USD maintains a bullish technical structure across all timeframes, supported by price action above key moving averages.
- Mixed momentum and overbought signals from oscillators point to short-term buyer dominance but waning upside potential.
- Expected trading range over the next 2–3 days is $292.41 to $310.77, with a 62% probability of an upward move.
Bullish oscillators diverge from weak trend momentum
On the technical front, TXN currently trades above the MA-20 at $297.12 and MA-50 at $295.39 on the H1 chart, as well as above the long-term MA-200 at $216.69 on the daily chart. The Ichimoku Kijun sits at $295.72, providing immediate support. The Moving Average Convergence Divergence (MACD) indicates strong sell momentum, while the Average Directional Index (ADX) remains neutral. The Relative Strength Index (RSI) stands at 57.12, and the Commodity Channel Index (CCI) is also in buy territory. However, both the Stochastic RSI and Bull/Bear Power are showing overbought readings, pointing toward short-term buyer dominance with less upside potential. The Awesome Oscillator is neutral, and overall, there is a divergence between bullish oscillator signals and weak trend momentum, creating a mixed technical picture.
Upward bias prevails as resistance caps further gains
Over the next 2–3 trading days, TXN is expected to fluctuate between $292.41 and $310.77. The probability of an upward move is estimated at 62%, making a downward move less likely at 38%. The base case envisions oscillation within this price corridor. A clear break above the upper resistance could trigger further gains, while a bearish move could unfold if price slips below immediate support.
Earlier, analysts noted that Texas Instruments was experiencing persistent selling pressure and heightened caution amid a shift in its technical momentum and index classification. With the current break above key moving averages and mixed oscillator signals, traders should closely monitor for a breakout above $310.77 or a reversal below $292.41 as cues for the prevailing direction in the days ahead.



Latest Texas Instruments News






-
 Afghanistan
-
 Albania
-
 Algeria
-
 Angola
-
 Argentina
-
 Armenia
-
 Australia
-
 Austria
-
 Azerbaijan
-
 Bahamas
-
 Bahrain
-
 Bangladesh
-
 Belarus
-
 Belgium
-
 Bolivia
-
 Botswana
-
 Brazil
-
 Brunei
-
 Bulgaria
-
 Cambodia
-
 Cameroon
-
 Canada
-
 Chile
Chile
-
 China
China
-
 Colombia
-
 Congo
Congo
-
 Costa Rica
-
 Cote d'Ivoire
-
 Croatia
-
 Cuba
Cuba
-
 Cyprus
-
 Czechia
-
 DR Congo
-
 Denmark
-
 Dominican Republic
-
 Ecuador
-
 Egypt
Egypt
-
 El Salvador
-
 Estonia
-
 Eswatini
-
 Ethiopia
-
 Finland
-
 France
-
 Georgia
-
 Germany
-
 Ghana
Ghana
-
 Greece
-
 Haiti
Haiti
-
 Hong Kong
-
 Hungary
-
 India
India
-
 Indonesia
-
 Iran, Islamic republic
-
 Iraq
Iraq
-
 Ireland
-
 Israel
-
 Italy
Italy
-
 Jamaica
-
 Japan
Japan
-
 Jordan
-
 Kazakhstan
-
 Kenya
Kenya
-
 Korea
Korea
-
 Kuwait
-
 Kyrgyzstan
-
 Laos
Laos
-
 Latvia
-
 Lebanon
-
 Lesotho
-
 Libya
Libya
-
 Lithuania
-
 Luxembourg
-
 Madagascar
-
 Malaysia
-
 Malta
Malta
-
 Mauritius
-
 Mexico
-
 Moldova
-
 Mongolia
-
 Montenegro
-
 Morocco
-
 Mozambique
-
 Myanmar
-
 Namibia
-
 Nepal
Nepal
-
 Netherlands
-
 New Zealand
-
 Nigeria
-
 North Macedonia
-
 Norway
-
 Oman
Oman
-
 Pakistan
-
 Palestine
-
 Panama
-
 Papua New Guinea
-
 Paraguay
-
 Peru
Peru
-
 Philippines
-
 Poland
-
 Portugal
-
 Puerto Rico
-
 Qatar
Qatar
-
 Reunion
-
 Romania
-
 Rwanda
-
 Saudi Arabia
-
 Serbia
-
 Singapore
-
 Slovakia
-
 Slovenia
-
 Somalia
-
 South Africa
-
 Spain
Spain
-
 Sri Lanka
-
 Sweden
-
 Switzerland
-
 Syria
Syria
-
 Taiwan
-
 Tajikistan
-
 Tanzania
-
 Thailand
-
 Trinidad and Tobago
-
 Tunisia
-
 Turkey
-
 UAE
UAE
-
 Uganda
-
 Ukraine
-
 United Kingdom
-
United States
-
 Uruguay
-
 Uzbekistan
-
 Venezuela
-
 Vietnam
-
 Yemen
Yemen
-
 Zambia
-
 Zimbabwe
- Forex
- Crypto











