
Texas Instruments shares drop over 4% after removal from Russell value and defensive benchmarks

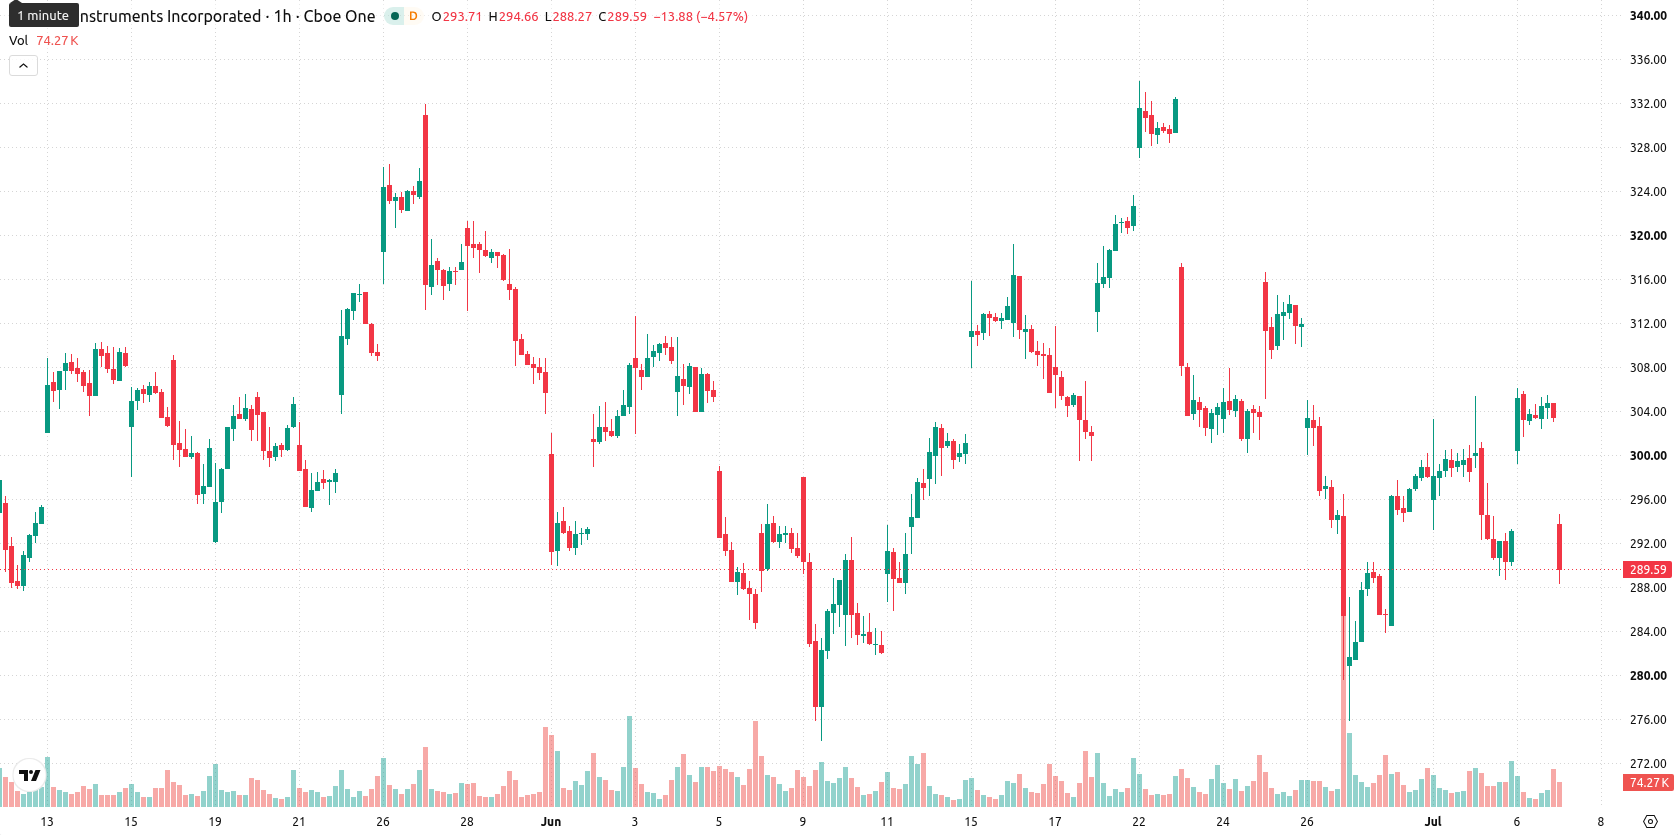
Texas Instruments (TXN) stock is trading at $290.34, down 4.34% for the day and near the session's lows. The stock currently sits below its key short- and mid-term moving averages, indicating firm selling momentum in the daily action.
 312.84
315.34
312.84
315.34
Highlights
- Texas Instruments' removal from Russell value and defensive indexes and inclusion in growth-focused benchmarks is triggering potential portfolio adjustments by index-tracking investors.
- This reclassification may influence short-term demand and liquidity dynamics for Texas Instruments as institutional flows shift.
- Technically, the stock faces strong short-term selling with persistent bearish momentum, as price trades near $290.34 and is likely to oscillate between $282.66 and $305.89 in coming days.
Liquidity and demand shift as index reclassification drives investor repositioning
In late June 2026, Texas Instruments was removed from several Russell value and defensive benchmarks and included in the Russell 1000 Dynamic and Russell Top 50 indexes, according to Simplywall and Finance Yahoo. This reclassification has changed the stock's profile among major equity benchmarks, potentially prompting institutional investors who track index compositions to adjust their holdings. Such shifts can alter near-term demand and liquidity for Texas Instruments as its role within index-tracking strategies adapts, though price action has remained under broader selling pressure.
Technical resistance holds as oscillators diverge on momentum outlook
On the H1 chart, TXN is trading below the MA-20 at $298.47 and the MA-50 at $298.01, with both conveying near-term resistance, while the daily MA-200 at $216.13 underpins long-term support. The Ichimoku Kijun sits at $297.25, marking immediate resistance. Among momentum indicators, the Moving Average Convergence Divergence (MACD) signals a strong buy despite most oscillators favoring sellers: the Relative Strength Index (RSI) stands at 38.88, with oversold conditions also flagged by the Stochastic RSI, Commodity Channel Index (CCI), and Bull/Bear Power. The Average Directional Index (ADX) and Awesome Oscillator both reflect a neutral posture, and price remains close to today’s low, signaling persistent selling momentum and moderate volatility, while the MACD's divergence with other oscillators underscores uncertainty regarding an immediate rebound.
Bearish extension risk as price remains near support range
Over the next several sessions, TXN is likely to oscillate within the $282.66 to $305.89 band as typical for volatility at current levels. The probability for an upward move remains low at 29%, while a downside swing is much more likely at 71%. If price rallies above resistance near $297.25, a bullish scenario would be triggered by renewed buyer interest. Conversely, fresh lows below $282.66 would confirm a bearish extension and bring renewed selling momentum into play.
Earlier, analysts noted that Texas Instruments was experiencing mixed technical momentum amid persistent uncertainty over its short-term trajectory. The latest shift in index classifications and mounting selling pressure strengthen the case for heightened caution, with traders now closely watching for a sustained move below $282.66 as a potential trigger for renewed downside risk.


Latest Texas Instruments News






-
 Afghanistan
-
 Albania
-
 Algeria
-
 Angola
-
 Argentina
-
 Armenia
-
 Australia
-
 Austria
-
 Azerbaijan
-
 Bahamas
-
 Bahrain
-
 Bangladesh
-
 Belarus
-
 Belgium
-
 Bolivia
-
 Botswana
-
 Brazil
-
 Brunei
-
 Bulgaria
-
 Cambodia
-
 Cameroon
-
 Canada
-
 Chile
Chile
-
 China
China
-
 Colombia
-
 Congo
Congo
-
 Costa Rica
-
 Cote d'Ivoire
-
 Croatia
-
 Cuba
Cuba
-
 Cyprus
-
 Czechia
-
 DR Congo
-
 Denmark
-
 Dominican Republic
-
 Ecuador
-
 Egypt
Egypt
-
 El Salvador
-
 Estonia
-
 Eswatini
-
 Ethiopia
-
 Finland
-
 France
-
 Georgia
-
 Germany
-
 Ghana
Ghana
-
 Greece
-
 Haiti
Haiti
-
 Hong Kong
-
 Hungary
-
 India
India
-
 Indonesia
-
 Iran, Islamic republic
-
 Iraq
Iraq
-
 Ireland
-
 Israel
-
 Italy
Italy
-
 Jamaica
-
 Japan
Japan
-
 Jordan
-
 Kazakhstan
-
 Kenya
Kenya
-
 Korea
Korea
-
 Kuwait
-
 Kyrgyzstan
-
 Laos
Laos
-
 Latvia
-
 Lebanon
-
 Lesotho
-
 Libya
Libya
-
 Lithuania
-
 Luxembourg
-
 Madagascar
-
 Malaysia
-
 Malta
Malta
-
 Mauritius
-
 Mexico
-
 Moldova
-
 Mongolia
-
 Montenegro
-
 Morocco
-
 Mozambique
-
 Myanmar
-
 Namibia
-
 Nepal
Nepal
-
 Netherlands
-
 New Zealand
-
 Nigeria
-
 North Macedonia
-
 Norway
-
 Oman
Oman
-
 Pakistan
-
 Palestine
-
 Panama
-
 Papua New Guinea
-
 Paraguay
-
 Peru
Peru
-
 Philippines
-
 Poland
-
 Portugal
-
 Puerto Rico
-
 Qatar
Qatar
-
 Reunion
-
 Romania
-
 Rwanda
-
 Saudi Arabia
-
 Serbia
-
 Singapore
-
 Slovakia
-
 Slovenia
-
 Somalia
-
 South Africa
-
 Spain
Spain
-
 Sri Lanka
-
 Sweden
-
 Switzerland
-
 Syria
Syria
-
 Taiwan
-
 Tajikistan
-
 Tanzania
-
 Thailand
-
 Trinidad and Tobago
-
 Tunisia
-
 Turkey
-
 UAE
UAE
-
 Uganda
-
 Ukraine
-
 United Kingdom
-
United States
-
 Uruguay
-
 Uzbekistan
-
 Venezuela
-
 Vietnam
-
 Yemen
Yemen
-
 Zambia
-
 Zimbabwe
- Forex
- Crypto











