
National Grid stock stays under pressure as dividends continue to rise

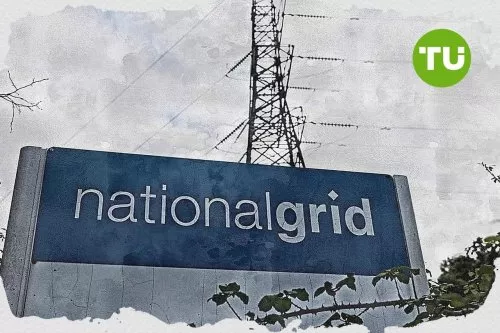
National Grid (NG) stock is trading at GBX1,236, registering a modest decline for the day as it moves down near today's session low. The share price currently sits below its short-term moving average while maintaining support over longer timeframes.
 1239.00
1253.00
1239.00
1253.00
Highlights
- National Grid's consistent dividends and history of increases position it as a stable income choice during inflationary periods.
- Solid financials contribute to the stock’s defensive appeal, sustaining investor interest despite modest share price fluctuations.
- Technical signals reflect short-term selling pressure and oscillators in oversold territory, with the price expected to move between GBX1,221 and GBX1,254 in coming sessions.
Dividend track record supports defensive appeal amid inflation concerns
National Grid has an established track record of paying and increasing dividends, according to Simplywall. This pattern of consistent dividend payments appeals to investors focused on stability and income, especially during periods of inflation. The company's financial solidity creates a defensive profile for the stock, helping maintain investor demand despite modest fluctuations in share price.
Mixed momentum as resistance and neutral signals split short-term trend
On the hourly chart, NG is trading below the 20-period moving average and just above the 50-period moving average, while on the daily timeframe, it stays above the 200-period moving average. The Ichimoku Kijun level is at GBX1,236, which now serves as immediate resistance. Among momentum indicators, the Moving Average Convergence Divergence (MACD) presents a strong buy, whereas the Average Directional Index (ADX), Commodity Channel Index (CCI), and Awesome Oscillator are neutral. The Relative Strength Index (RSI) signals a sell; the Stochastic RSI and Bull/Bear Power both indicate oversold conditions, signaling sellers' control in intraday trading. The technical landscape depicts mixed short-term momentum with divergence across key oscillators and trend-following signals.
Sideways price bias as neutral signals define volatility boundary
Over the next few sessions, NG is expected to fluctuate between GBX1,221 and GBX1,254, reflecting a volatility band relative to current levels. The baseline expectation is for price to move sideways within this range due to neutral technical readings and recent trading patterns. A close above the Ichimoku Kijun resistance at GBX1,236 would open scope for a move towards the upper end near GBX1,254. Alternatively, a decisive drop below GBX1,221 would signal renewed seller momentum and potential further declines.
Previously it was reported that the UK's efforts to enhance low-carbon energy security included long-term support for nuclear assets such as Sizewell B amid volatile energy markets. Against this backdrop, National Grid’s defensive financial profile and stable dividend record are likely to sustain investor interest, with the key focus now on whether the share price can decisively break resistance at GBX1,236 to signal any renewed upward momentum.



Latest National Grid News






-
 Afghanistan
-
 Albania
-
 Algeria
-
 Angola
-
 Argentina
-
 Armenia
-
 Australia
-
 Austria
-
 Azerbaijan
-
 Bahamas
-
 Bahrain
-
 Bangladesh
-
 Belarus
-
 Belgium
-
 Bolivia
-
 Botswana
-
 Brazil
-
 Brunei
-
 Bulgaria
-
 Cambodia
-
 Cameroon
-
 Canada
-
 Chile
Chile
-
 China
China
-
 Colombia
-
 Congo
Congo
-
 Costa Rica
-
 Cote d'Ivoire
-
 Croatia
-
 Cuba
Cuba
-
 Cyprus
-
 Czechia
-
 DR Congo
-
 Denmark
-
 Dominican Republic
-
 Ecuador
-
 Egypt
Egypt
-
 El Salvador
-
 Estonia
-
 Eswatini
-
 Ethiopia
-
 Finland
-
 France
-
 Georgia
-
 Germany
-
 Ghana
Ghana
-
 Greece
-
 Haiti
Haiti
-
 Hong Kong
-
 Hungary
-
 India
India
-
 Indonesia
-
 Iran, Islamic republic
-
 Iraq
Iraq
-
 Ireland
-
 Israel
-
 Italy
Italy
-
 Jamaica
-
 Japan
Japan
-
 Jordan
-
 Kazakhstan
-
 Kenya
Kenya
-
 Korea
Korea
-
 Kuwait
-
 Kyrgyzstan
-
 Laos
Laos
-
 Latvia
-
 Lebanon
-
 Lesotho
-
 Libya
Libya
-
 Lithuania
-
 Luxembourg
-
 Madagascar
-
 Malaysia
-
 Malta
Malta
-
 Mauritius
-
 Mexico
-
 Moldova
-
 Mongolia
-
 Montenegro
-
 Morocco
-
 Mozambique
-
 Myanmar
-
 Namibia
-
 Nepal
Nepal
-
 Netherlands
-
 New Zealand
-
 Nigeria
-
 North Macedonia
-
 Norway
-
 Oman
Oman
-
 Pakistan
-
 Palestine
-
 Panama
-
 Papua New Guinea
-
 Paraguay
-
 Peru
Peru
-
 Philippines
-
 Poland
-
 Portugal
-
 Puerto Rico
-
 Qatar
Qatar
-
 Reunion
-
 Romania
-
 Rwanda
-
 Saudi Arabia
-
 Serbia
-
 Singapore
-
 Slovakia
-
 Slovenia
-
 Somalia
-
 South Africa
-
 Spain
Spain
-
 Sri Lanka
-
 Sweden
-
 Switzerland
-
 Syria
Syria
-
 Taiwan
-
 Tajikistan
-
 Tanzania
-
 Thailand
-
 Trinidad and Tobago
-
 Tunisia
-
 Turkey
-
 UAE
UAE
-
 Uganda
-
 Ukraine
-
 United Kingdom
-
United States
-
 Uruguay
-
 Uzbekistan
-
 Venezuela
-
 Vietnam
-
 Yemen
Yemen
-
 Zambia
-
 Zimbabwe
- Forex
- Crypto











