
Can Apple stock break resistance as EU Digital Markets Act weighs on outlook?

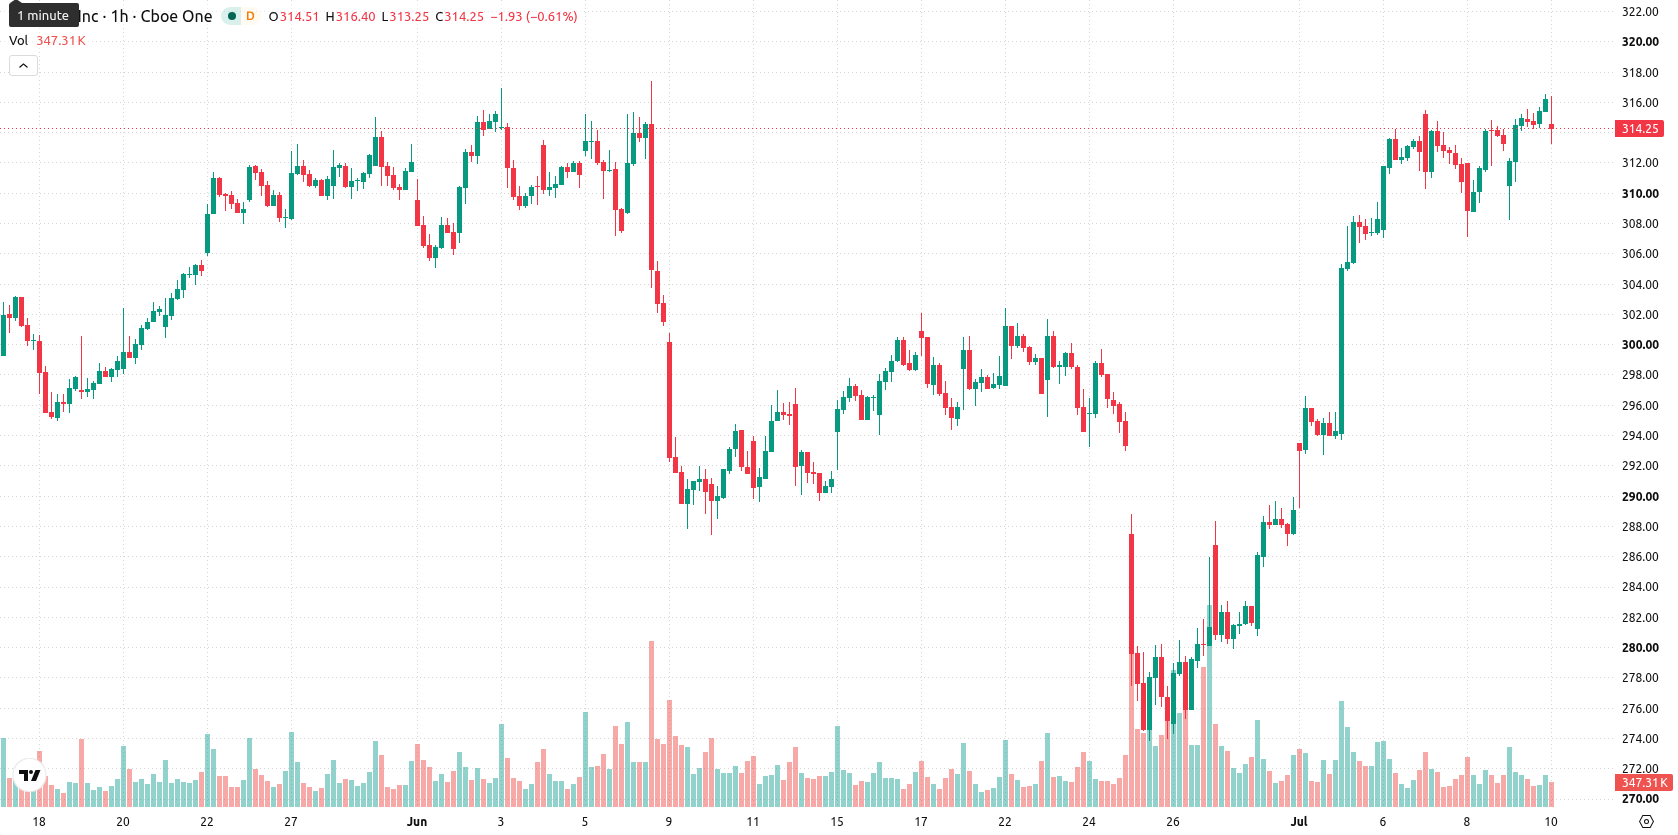
Apple Inc. (AAPL) stock is trading at $316.18 after a daily advance, with the price holding comfortably above its key short- and medium-term moving averages. The stock remains well supported by its upward momentum and sits above its longer-term averages.
 314.08
316.47
314.08
316.47
Highlights
- Apple secured a multiyear chip supply deal exceeding $30 billion with Broadcom to strengthen its U.S. manufacturing base and reduce supply chain risks.
- Regulatory pressure increased as an EU court affirmed that App Store and iOS face enhanced compliance under the Digital Markets Act.
- AAPL/USD trades in a strong bullish trend with a projected range of $311.94 to $320.42, though overbought signals suggest a risk of short-term pullback.
Investor confidence grows as supply chain diversifies and regulatory risks mount
Apple’s recently announced multiyear agreement worth over $30 billion with Broadcom to produce chips in the United States, as reported by Thehindu, strengthens its domestic supply chain and reduces future manufacturing risks. This strategic partnership is expected to reinforce investor demand by signaling secure hardware development and innovation capacity for Apple in the years ahead. Meanwhile, regulatory challenges persist as the European General Court confirmed, according to Techtimes, that Apple’s App Store and iOS fall under the EU’s Digital Markets Act, potentially increasing compliance burdens; in parallel, Apple’s discussions with PrismML over on-device AI model compression highlight ongoing efforts at product differentiation.
Intraday buyer strength confirmed as overbought signals accumulate
On the technical front, AAPL is trading above its MA-20 ($313.16) and MA-50 ($305.42) on the H1 chart, while the daily price remains well above the MA-200 ($272.14). The Ichimoku Kijun indicator identifies $311.76 as the nearest key support. Momentum readings show MACD at a Strong Buy and the Average Directional Index (ADX) indicating a Buy signal. The Relative Strength Index (RSI) sits at 67.59, with Stochastic RSI, Commodity Channel Index (CCI), and Bull/Bear Power reflecting overbought conditions. The Awesome Oscillator is also in buy territory, collectively confirming strong intraday buyer dominance even as several oscillators warn of a stretched market.
Further gains favored as volatility defines trading range
Over the short term, AAPL is expected to trade in a broad range between $311.94 and $320.42, reflecting typical volatility bands relative to current levels. The probability of further gains remains very high, with a low likelihood of a reversal in the near term. If the upper resistance is breached, further upside momentum could emerge, while a breakdown below established support would open the door for corrective pullbacks toward lower price levels.
Earlier, analysts noted that Apple's expanding AI capabilities and ecosystem were underpinning a broadly constructive long-term outlook for the stock. The recent combination of strengthened domestic supply chain partnerships and robust technical momentum reinforces this positive view, making the $320.42 resistance the key level for investors to monitor as a possible trigger for continued gains.



Latest Apple News







-
 Afghanistan
-
 Albania
-
 Algeria
-
 Angola
-
 Argentina
-
 Armenia
-
 Australia
-
 Austria
-
 Azerbaijan
-
 Bahamas
-
 Bahrain
-
 Bangladesh
-
 Belarus
-
 Belgium
-
 Bolivia
-
 Botswana
-
 Brazil
-
 Brunei
-
 Bulgaria
-
 Cambodia
-
 Cameroon
-
 Canada
-
 Chile
Chile
-
 China
China
-
 Colombia
-
 Congo
Congo
-
 Costa Rica
-
 Cote d'Ivoire
-
 Croatia
-
 Cuba
Cuba
-
 Cyprus
-
 Czechia
-
 DR Congo
-
 Denmark
-
 Dominican Republic
-
 Ecuador
-
 Egypt
Egypt
-
 El Salvador
-
 Estonia
-
 Eswatini
-
 Ethiopia
-
 Finland
-
 France
-
 Georgia
-
 Germany
-
 Ghana
Ghana
-
 Greece
-
 Haiti
Haiti
-
 Hong Kong
-
 Hungary
-
 India
India
-
 Indonesia
-
 Iran, Islamic republic
-
 Iraq
Iraq
-
 Ireland
-
 Israel
-
 Italy
Italy
-
 Jamaica
-
 Japan
Japan
-
 Jordan
-
 Kazakhstan
-
 Kenya
Kenya
-
 Korea
Korea
-
 Kuwait
-
 Kyrgyzstan
-
 Laos
Laos
-
 Latvia
-
 Lebanon
-
 Lesotho
-
 Libya
Libya
-
 Lithuania
-
 Luxembourg
-
 Madagascar
-
 Malaysia
-
 Malta
Malta
-
 Mauritius
-
 Mexico
-
 Moldova
-
 Mongolia
-
 Montenegro
-
 Morocco
-
 Mozambique
-
 Myanmar
-
 Namibia
-
 Nepal
Nepal
-
 Netherlands
-
 New Zealand
-
 Nigeria
-
 North Macedonia
-
 Norway
-
 Oman
Oman
-
 Pakistan
-
 Palestine
-
 Panama
-
 Papua New Guinea
-
 Paraguay
-
 Peru
Peru
-
 Philippines
-
 Poland
-
 Portugal
-
 Puerto Rico
-
 Qatar
Qatar
-
 Reunion
-
 Romania
-
 Rwanda
-
 Saudi Arabia
-
 Serbia
-
 Singapore
-
 Slovakia
-
 Slovenia
-
 Somalia
-
 South Africa
-
 Spain
Spain
-
 Sri Lanka
-
 Sweden
-
 Switzerland
-
 Syria
Syria
-
 Taiwan
-
 Tajikistan
-
 Tanzania
-
 Thailand
-
 Trinidad and Tobago
-
 Tunisia
-
 Turkey
-
 UAE
UAE
-
 Uganda
-
 Ukraine
-
 United Kingdom
-
United States
-
 Uruguay
-
 Uzbekistan
-
 Venezuela
-
 Vietnam
-
 Yemen
Yemen
-
 Zambia
-
 Zimbabwe
- Forex
- Crypto











