
Singapore cleanroom expansion lifts Applied Materials stock toward key resistance

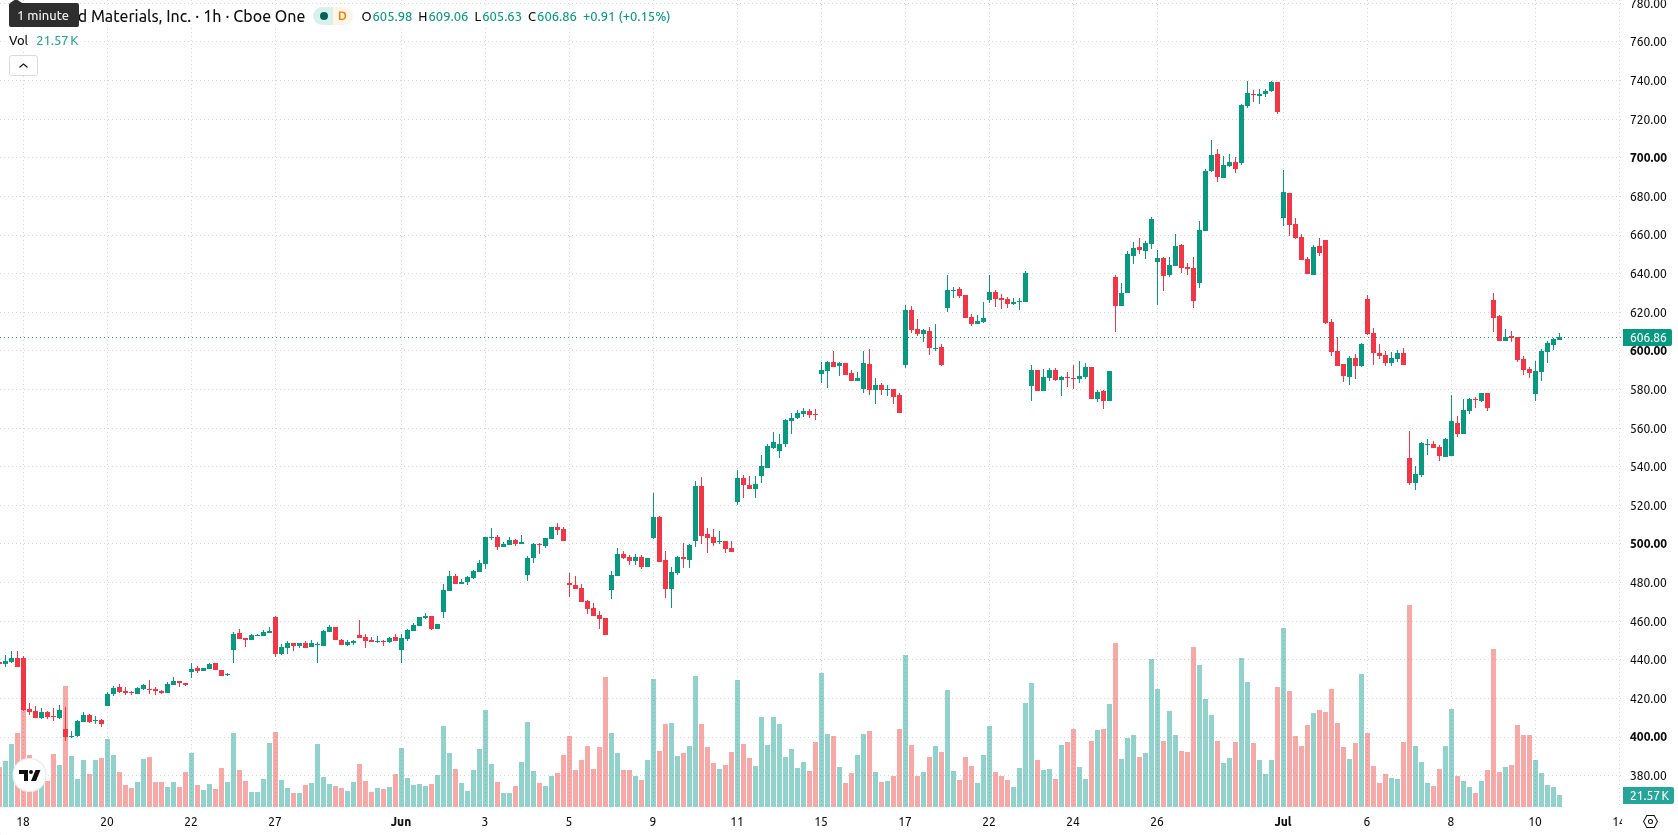
Applied Materials (AMAT) stock is trading at $608.24, advancing 3.33% on the day. The price sits above its key moving averages, reflecting strength across multiple timeframes.
 609.05
629.98
609.05
629.98
Highlights
- Applied Materials expanded advanced cleanroom capacity in Singapore, boosting infrastructure to meet increasing chipmaker demand for AI-related technology.
- Forthcoming changes to Russell index inclusion may prompt institutional rebalancing and sustain market attention for the stock.
- AMAT displays a bullish technical setup with strong upside probability, expected to trade between $562.47 and $654.01 in the coming days.
Production expansion and index shifts drive sustained investor attention
Applied Materials has more than doubled its advanced cleanroom capacity in Singapore, increasing its ability to serve growing chipmaker demand for AI-related technology, as noted by Blockonomi. This expansion directly provides the company with the infrastructure needed to secure higher production orders, supporting continued revenue and operational growth. In addition, the stock's removal from several Russell value-oriented indexes and addition to the Russell Top 50 Index in late June 2026, according to Simplywall, may rebalance institutional investor flows and maintain broad market attention.
Bullish signals dominant with overbought risks amid range-bound outlook
On the h1 chart, AMAT is trading above the MA-20 at $588.12 and MA-50 at $603.93, with the daily MA-200 positioned far lower at $347.22. The Ichimoku Kijun on the daily chart is set at $578.75, offering immediate support. The expected trading range over the next several days is $562.47 to $654.01. Momentum indicators are largely positive: the Moving Average Convergence Divergence (MACD) shows a buy signal, while the Average Directional Index (ADX) is neutral, indicating a market in transition rather than a strong trend. The Relative Strength Index (RSI) stands at 56.15 (buy), Commodity Channel Index (CCI) is in buy mode, and the Stochastic RSI remains neutral. Notably, Bull/Bear Power is in overbought territory, and the Awesome Oscillator is also on buy, confirming buyer dominance in today's session, though some overbought conditions are evident.
Consolidation likely unless demand or news sparks breakout
In the short term, AMAT is likely to consolidate within the forecast volatility band of $562.47 to $654.01. The primary scenario favors price stabilization at elevated levels, with a high probability for an upward breakout if chip demand or order news strengthen. Should resistance be breached, new highs are possible. Conversely, a drop below immediate support at $578.75 could prompt a retracement toward the lower boundary of the current range, though this is considered a less likely scenario given prevailing market momentum.
Earlier, analysts noted that Applied Materials was exhibiting strong bullish momentum, supported by robust technical signals and sustained buying pressure. The current analysis reinforces this outlook amid ongoing capacity expansion and evolving index membership, suggesting traders should monitor for a potential upward breakout if positive order flow or chip demand accelerates.



Latest Applied Materials News





-
 Afghanistan
-
 Albania
-
 Algeria
-
 Angola
-
 Argentina
-
 Armenia
-
 Australia
-
 Austria
-
 Azerbaijan
-
 Bahamas
-
 Bahrain
-
 Bangladesh
-
 Belarus
-
 Belgium
-
 Bolivia
-
 Botswana
-
 Brazil
-
 Brunei
-
 Bulgaria
-
 Cambodia
-
 Cameroon
-
 Canada
-
 Chile
Chile
-
 China
China
-
 Colombia
-
 Congo
Congo
-
 Costa Rica
-
 Cote d'Ivoire
-
 Croatia
-
 Cuba
Cuba
-
 Cyprus
-
 Czechia
-
 DR Congo
-
 Denmark
-
 Dominican Republic
-
 Ecuador
-
 Egypt
Egypt
-
 El Salvador
-
 Estonia
-
 Eswatini
-
 Ethiopia
-
 Finland
-
 France
-
 Georgia
-
 Germany
-
 Ghana
Ghana
-
 Greece
-
 Haiti
Haiti
-
 Hong Kong
-
 Hungary
-
 India
India
-
 Indonesia
-
 Iran, Islamic republic
-
 Iraq
Iraq
-
 Ireland
-
 Israel
-
 Italy
Italy
-
 Jamaica
-
 Japan
Japan
-
 Jordan
-
 Kazakhstan
-
 Kenya
Kenya
-
 Korea
Korea
-
 Kuwait
-
 Kyrgyzstan
-
 Laos
Laos
-
 Latvia
-
 Lebanon
-
 Lesotho
-
 Libya
Libya
-
 Lithuania
-
 Luxembourg
-
 Madagascar
-
 Malaysia
-
 Malta
Malta
-
 Mauritius
-
 Mexico
-
 Moldova
-
 Mongolia
-
 Montenegro
-
 Morocco
-
 Mozambique
-
 Myanmar
-
 Namibia
-
 Nepal
Nepal
-
 Netherlands
-
 New Zealand
-
 Nigeria
-
 North Macedonia
-
 Norway
-
 Oman
Oman
-
 Pakistan
-
 Palestine
-
 Panama
-
 Papua New Guinea
-
 Paraguay
-
 Peru
Peru
-
 Philippines
-
 Poland
-
 Portugal
-
 Puerto Rico
-
 Qatar
Qatar
-
 Reunion
-
 Romania
-
 Rwanda
-
 Saudi Arabia
-
 Serbia
-
 Singapore
-
 Slovakia
-
 Slovenia
-
 Somalia
-
 South Africa
-
 Spain
Spain
-
 Sri Lanka
-
 Sweden
-
 Switzerland
-
 Syria
Syria
-
 Taiwan
-
 Tajikistan
-
 Tanzania
-
 Thailand
-
 Trinidad and Tobago
-
 Tunisia
-
 Turkey
-
 UAE
UAE
-
 Uganda
-
 Ukraine
-
 United Kingdom
-
United States
-
 Uruguay
-
 Uzbekistan
-
 Venezuela
-
 Vietnam
-
 Yemen
Yemen
-
 Zambia
-
 Zimbabwe
- Forex
- Crypto











