
SBA Communications shares technical analysis: Breakout attempt above $192.91 resistance in focus

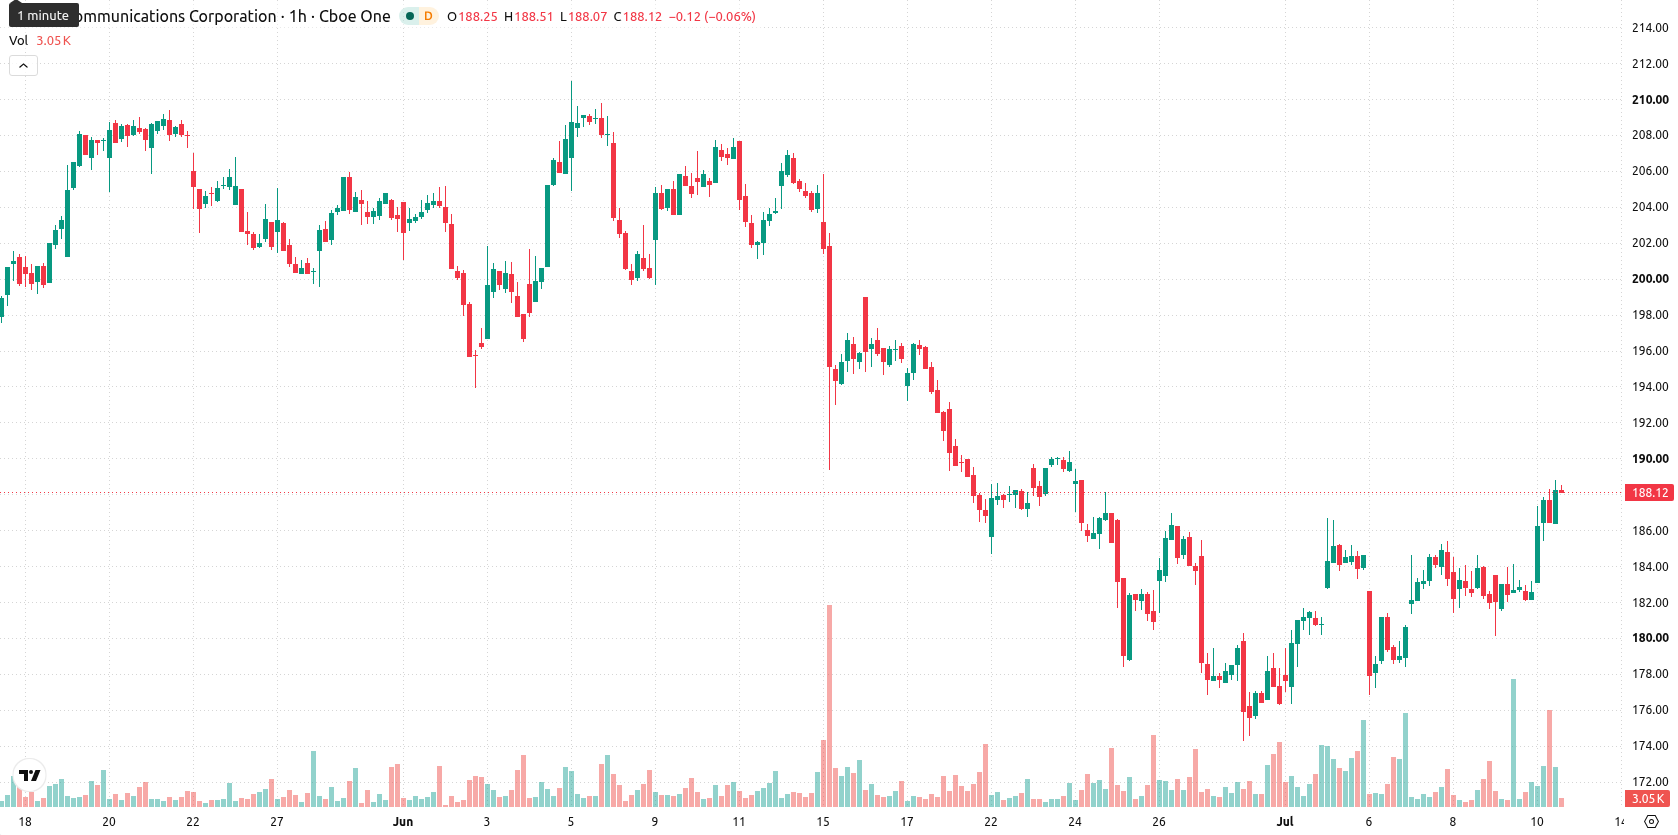
SBA Communications (SBAC) stock is trading at $188.11, up 3.09% on the day and posting gains near the daily high. The current price sits above its key moving averages, indicating intraday bullish momentum.
 188.84
185.52
188.84
185.52
Highlights
- SBAC/USD shows short- and medium-term bullish momentum, yet long-term resistance remains intact as it trades below key averages.
- Momentum indicators are mixed, with intraday signals mostly bullish but multiple overbought warnings flagging potential for near-term pullback.
- Expected price range for the coming sessions is $184.23 to $192.91, with a 68% probability of sideways-to-upside consolidation unless $184.23 support breaks.
Mixed momentum as indicators diverge at technical boundaries
On the hourly chart, the price remains above the 20-period moving average at $183.89 and the 50-period moving average at $182.41, while the daily chart places it below the longer-term 200-period moving average at $195.22. Immediate support is defined by the Ichimoku Kijun at $184.47, with the short-term support boundary at $184.23 and resistance at $192.91. The Moving Average Convergence Divergence (MACD) indicator signals a buy, while the Average Directional Index (ADX) remains neutral, highlighting a lack of strong trend confirmation. The Relative Strength Index (RSI) is also in buy territory, but overbought readings via the Commodity Channel Index (CCI) and Bull/Bear Power suggest caution. Meanwhile, Stochastic RSI is in strong sell mode and the Awesome Oscillator confirms upward momentum.
Upside favored as consolidation persists within range
Over the coming sessions, SBAC is expected to consolidate in a volatility band ranging from $184.23 to $192.91. Further upside has a higher probability at 68%, while downside risks are seen at 32%. The baseline case suggests sideways movement persists unless a breakout above resistance or a failure of support triggers a directional move.
Earlier, analysts noted that SBA Communications was experiencing persistent bearish momentum driven by strong selling pressure. The latest rebound above short-term moving averages introduces a potential shift in sentiment, making a close watch on a break above key resistance or a loss of support essential for assessing the next directional move.



Latest SBA Communications Corp News






-
 Afghanistan
-
 Albania
-
 Algeria
-
 Angola
-
 Argentina
-
 Armenia
-
 Australia
-
 Austria
-
 Azerbaijan
-
 Bahamas
-
 Bahrain
-
 Bangladesh
-
 Belarus
-
 Belgium
-
 Bolivia
-
 Botswana
-
 Brazil
-
 Brunei
-
 Bulgaria
-
 Cambodia
-
 Cameroon
-
 Canada
-
 Chile
Chile
-
 China
China
-
 Colombia
-
 Congo
Congo
-
 Costa Rica
-
 Cote d'Ivoire
-
 Croatia
-
 Cuba
Cuba
-
 Cyprus
-
 Czechia
-
 DR Congo
-
 Denmark
-
 Dominican Republic
-
 Ecuador
-
 Egypt
Egypt
-
 El Salvador
-
 Estonia
-
 Eswatini
-
 Ethiopia
-
 Finland
-
 France
-
 Georgia
-
 Germany
-
 Ghana
Ghana
-
 Greece
-
 Haiti
Haiti
-
 Hong Kong
-
 Hungary
-
 India
India
-
 Indonesia
-
 Iran, Islamic republic
-
 Iraq
Iraq
-
 Ireland
-
 Israel
-
 Italy
Italy
-
 Jamaica
-
 Japan
Japan
-
 Jordan
-
 Kazakhstan
-
 Kenya
Kenya
-
 Korea
Korea
-
 Kuwait
-
 Kyrgyzstan
-
 Laos
Laos
-
 Latvia
-
 Lebanon
-
 Lesotho
-
 Libya
Libya
-
 Lithuania
-
 Luxembourg
-
 Madagascar
-
 Malaysia
-
 Malta
Malta
-
 Mauritius
-
 Mexico
-
 Moldova
-
 Mongolia
-
 Montenegro
-
 Morocco
-
 Mozambique
-
 Myanmar
-
 Namibia
-
 Nepal
Nepal
-
 Netherlands
-
 New Zealand
-
 Nigeria
-
 North Macedonia
-
 Norway
-
 Oman
Oman
-
 Pakistan
-
 Palestine
-
 Panama
-
 Papua New Guinea
-
 Paraguay
-
 Peru
Peru
-
 Philippines
-
 Poland
-
 Portugal
-
 Puerto Rico
-
 Qatar
Qatar
-
 Reunion
-
 Romania
-
 Rwanda
-
 Saudi Arabia
-
 Serbia
-
 Singapore
-
 Slovakia
-
 Slovenia
-
 Somalia
-
 South Africa
-
 Spain
Spain
-
 Sri Lanka
-
 Sweden
-
 Switzerland
-
 Syria
Syria
-
 Taiwan
-
 Tajikistan
-
 Tanzania
-
 Thailand
-
 Trinidad and Tobago
-
 Tunisia
-
 Turkey
-
 UAE
UAE
-
 Uganda
-
 Ukraine
-
 United Kingdom
-
United States
-
 Uruguay
-
 Uzbekistan
-
 Venezuela
-
 Vietnam
-
 Yemen
Yemen
-
 Zambia
-
 Zimbabwe
- Forex
- Crypto











