

Tradeweb stock rallies as AI-powered assistant for credit market traders attracts attention

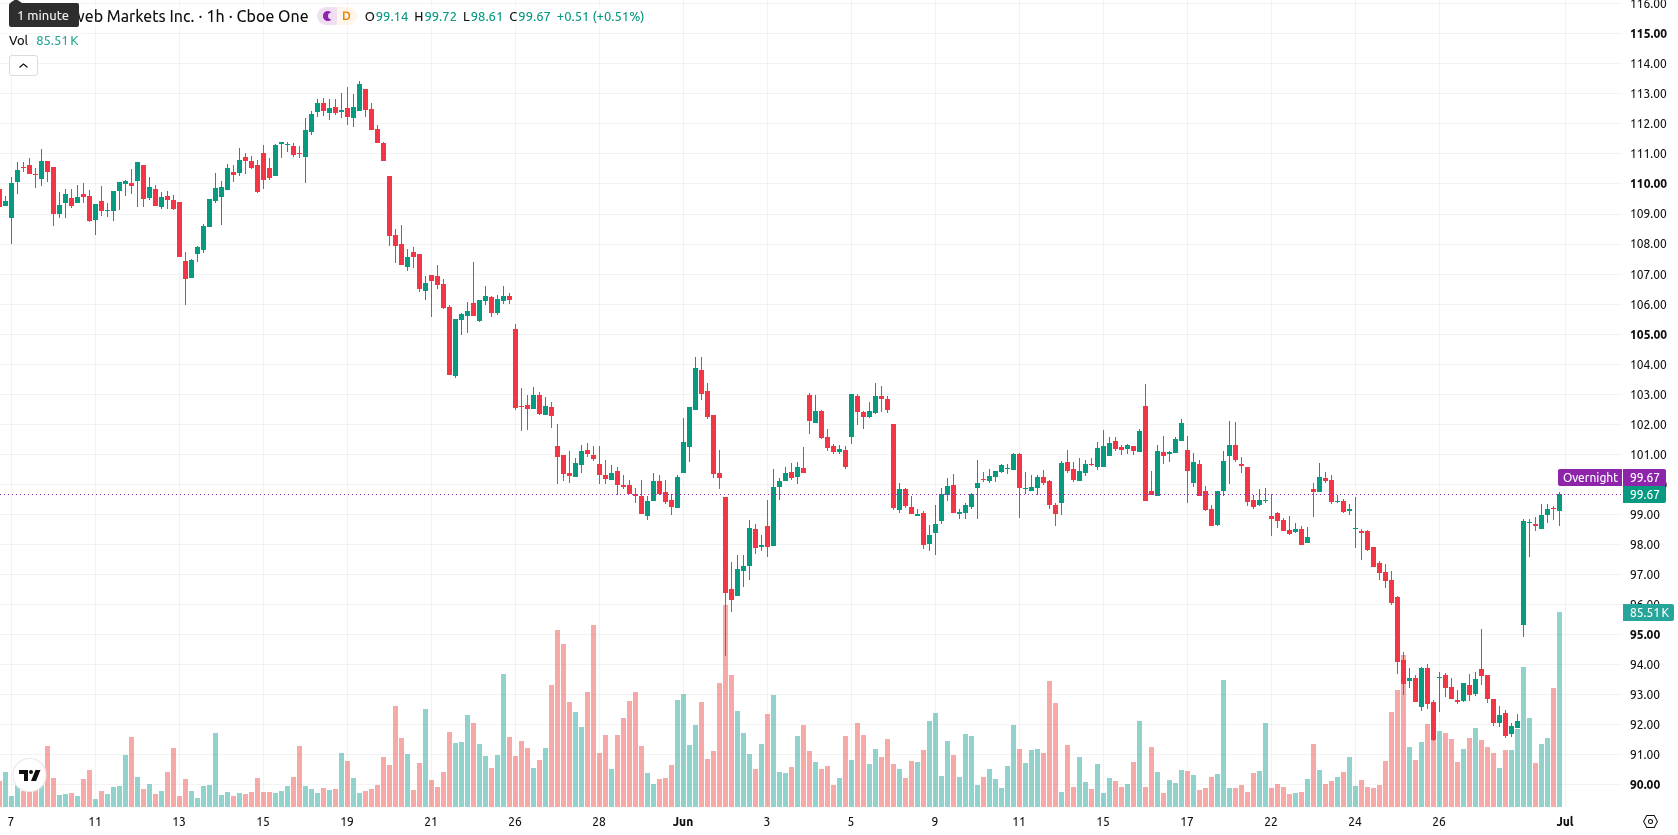
Tradeweb (TW) stock is trading at $99.66, climbing 8.21% on the day and closing near the session high. The share price sits above its short- and medium-term moving averages, highlighting strong momentum over recent sessions.
 125.21
Highlights
- Tradeweb's launch of TARA, an AI-driven market intelligence assistant, aims to strengthen its role in U.S. credit market trading.
- This innovation underscores Tradeweb’s commitment to automation and may boost institutional engagement and transaction volume on its platform.
- Bullish momentum dominates with aggressive intraday buying, an expected price range of $96.05 to $103.27, and overbought technical conditions suggesting possible consolidation or volatility ahead.
Product launch fuels competitive edge amid rising institutional flows
Tradeweb has announced the launch of TARA, an AI-powered assistant designed to deliver market intelligence and trading information to U.S. credit market traders, according to Investing.com. By expanding its suite of technology-driven tools, Tradeweb deepens its competitive position among electronic trading platforms, potentially driving greater engagement and transaction flow from institutional clients. This product rollout underscores the company’s continuing push into innovation and automation, which is likely to support elevated demand for its services in the evolving credit markets.
Overbought technical signals temper strong bullish indicators
On the hourly chart, TW is trading above the 20-period moving average at $94.92 and the 50-period moving average at $96.24, while remaining below the 200-period moving average at $110.35 on the daily timeframe. The Ichimoku Kijun on the daily chart marks immediate support at $95.55, with key levels for the coming sessions at $96.05 (support) and $103.27 (resistance). The Moving Average Convergence Divergence (MACD), Average Directional Index (ADX), and Awesome Oscillator all indicate bullish momentum. However, the Relative Strength Index (RSI), Stochastic RSI, Commodity Channel Index (CCI), and Bull/Bear Power are in overbought territory, suggesting the buying pressure may be stretched.
Sideways action likely as breakout and retracement risks persist
Looking ahead, TW is expected to consolidate within a typical volatility band between $96.05 and $103.27 over the next several days. There is a 64% probability of an upward move, with the baseline scenario calling for sideways price action between support and resistance. A decisive rally above $103.27 would open room for further gains, while a drop below $96.05 could trigger a deeper retracement.
Earlier, analysts noted that traditional financial firms like Tradeweb have been expanding their participation in onchain data ecosystems and digital infrastructure. Today’s strong price action, alongside the launch of TARA and robust technical momentum, points to continued leadership in technology adoption—investors should monitor for a confirmed breakout above $103.27 as a signal of renewed upside.






Latest Tradeweb Markets News



-
 Afghanistan
-
 Albania
-
 Algeria
-
 Angola
-
 Argentina
-
 Armenia
-
 Australia
-
 Austria
-
 Azerbaijan
-
 Bahamas
-
 Bahrain
-
 Bangladesh
-
 Belarus
-
 Belgium
-
 Bolivia
-
 Botswana
-
 Brazil
-
 Brunei
-
 Bulgaria
-
 Cambodia
-
 Cameroon
-
 Canada
-
 Chile
-
 China
-
 Colombia
-
 Congo
-
 Costa Rica
-
 Cote d'Ivoire
-
 Croatia
-
 Cuba
-
 Cyprus
-
 Czechia
-
 DR Congo
-
 Denmark
-
 Dominican Republic
-
 Ecuador
-
 Egypt
-
 El Salvador
-
 Estonia
-
 Eswatini
-
 Ethiopia
-
 Finland
-
 France
-
 Georgia
-
 Germany
-
 Ghana
-
 Greece
-
 Haiti
-
 Hong Kong
-
 Hungary
-
 India
-
 Indonesia
-
 Iran, Islamic republic
-
 Iraq
-
 Ireland
-
 Israel
-
 Italy
-
 Jamaica
-
 Japan
-
 Jordan
-
 Kazakhstan
-
 Kenya
-
 Korea
-
 Kuwait
-
 Kyrgyzstan
-
 Laos
-
 Latvia
-
 Lebanon
-
 Lesotho
-
 Libya
-
 Lithuania
-
 Luxembourg
-
 Madagascar
-
 Malaysia
-
 Malta
-
 Mauritius
-
 Mexico
-
 Moldova
-
 Mongolia
-
 Montenegro
-
 Morocco
-
 Mozambique
-
 Myanmar
-
 Namibia
-
 Nepal
-
 Netherlands
-
 New Zealand
-
 Nigeria
-
 North Macedonia
-
 Norway
-
 Oman
-
 Pakistan
-
 Palestine
-
 Panama
-
 Papua New Guinea
-
 Paraguay
-
 Peru
-
 Philippines
-
 Poland
-
 Portugal
-
 Puerto Rico
-
 Qatar
-
 Reunion
-
 Romania
-
 Rwanda
-
 Saudi Arabia
-
 Serbia
-
 Singapore
-
 Slovakia
-
 Slovenia
-
 Somalia
-
 South Africa
-
 Spain
-
 Sri Lanka
-
 Sweden
-
 Switzerland
-
 Syria
-
 Taiwan
-
 Tajikistan
-
 Tanzania
-
 Thailand
-
 Trinidad and Tobago
-
 Tunisia
-
 Turkey
-
 UAE
-
 Uganda
-
 Ukraine
-
 United Kingdom
-
United States
-
 Uruguay
-
 Uzbekistan
-
 Venezuela
-
 Vietnam
-
 Yemen
-
 Zambia
-
 Zimbabwe
- Forex
- Crypto












