

Why is Barrick Gold stock falling today? Sellers dominate short-term trend; support levels in focus

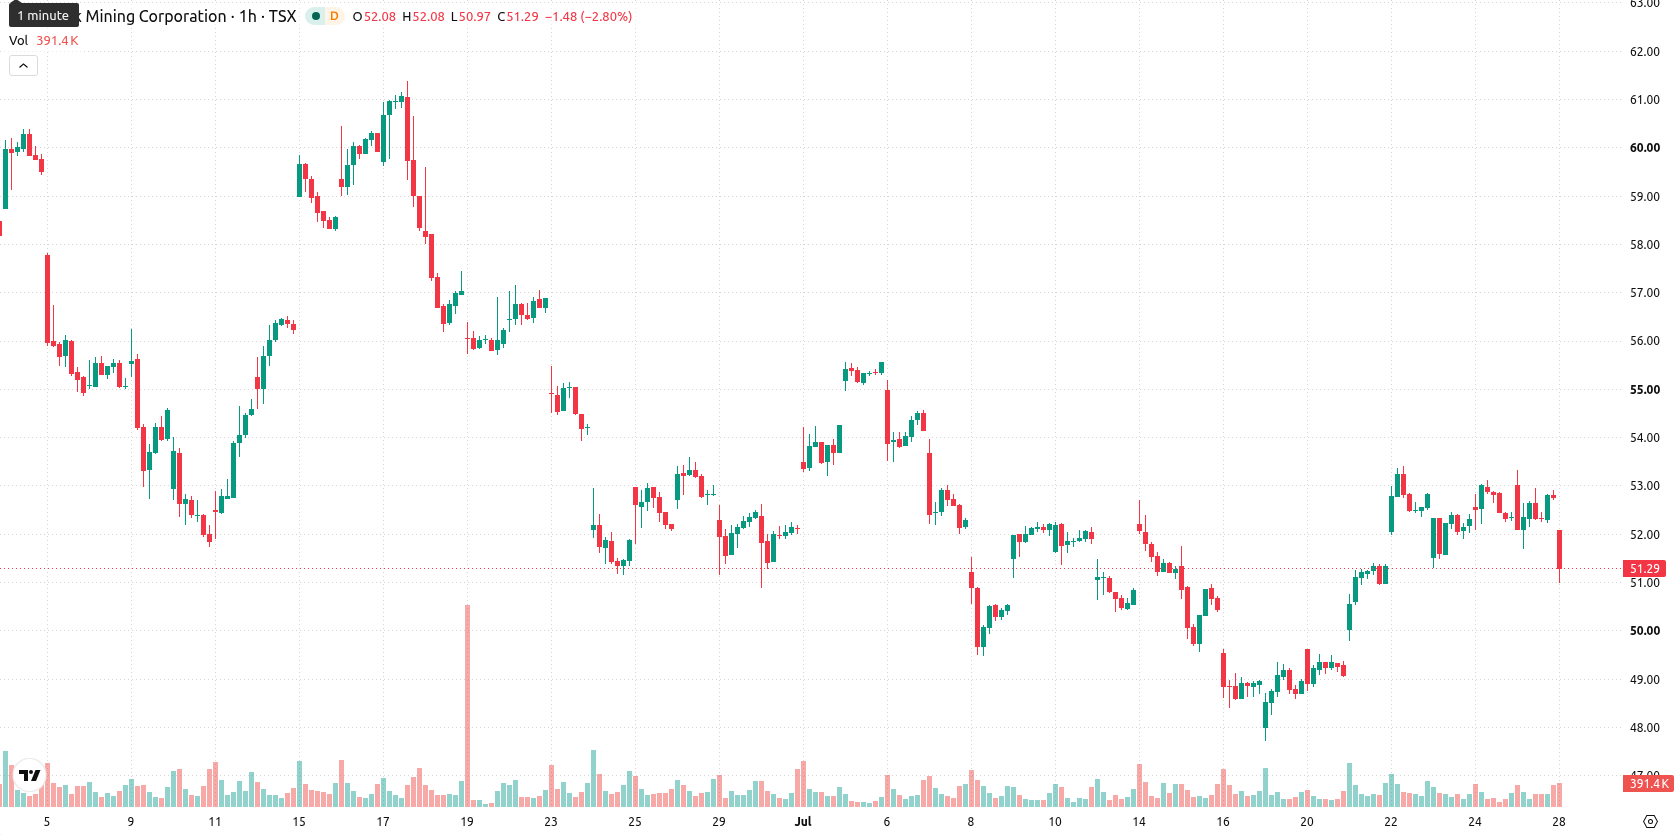
Barrick Gold (ABX) stock is trading at C$51.3, down 2.79% on the day. The stock is currently positioned below its key moving averages and reflects moderate intraday volatility.
 53.05
55.57
Highlights
- ABX/CAD trades below major moving averages, confirming sustained bearish momentum across all time frames.
- Multiple indicators signal oversold conditions and persistent seller control, although MACD suggests reversal risk.
- Price is forecast to consolidate between C$50.36 and C$53.46, with downside or sideways movement favored near term.
Mixed momentum and oversold signals pressure key resistance
ABX is trading below the MA-20 at C$52.43, MA-50 at C$51.31, and MA-200 at C$57.27. The Ichimoku Kijun is set at C$52.26 and acts as immediate resistance. Momentum signals are mixed: MACD signals a strong buy, while RSI gives a sell and ADX is neutral. Stoch RSI, CCI, and Bull/Bear Power indicate oversold conditions and dominant selling pressure intraday, and the Awesome Oscillator lacks a clear directional bias.
Consolidation favored as upside probability remains limited
Over the next several days, ABX is expected to trade between C$50.36 and C$53.46. There is a 32% probability assigned to an upward move within this range, suggesting a downward or sideways scenario is more likely. The baseline expectation is for price to consolidate within this band, with a potential test of C$53.46 if bullish momentum returns or a slide toward C$50.36 if seller control persists.
Earlier, analysts noted that Barrick Gold was under persistent bearish pressure, with downside momentum dominating its technical outlook. The latest signals indicate that while consolidation remains the baseline scenario, traders should closely monitor for a decisive move outside the C$50.36–C$53.46 range, as a breakout could set the tone for the next directional trend.










-
 Afghanistan
-
 Albania
-
 Algeria
-
 Angola
-
 Argentina
-
 Armenia
-
 Australia
-
 Austria
-
 Azerbaijan
-
 Bahamas
-
 Bahrain
-
 Bangladesh
-
 Belarus
-
 Belgium
-
 Bolivia
-
 Botswana
-
 Brazil
-
 Brunei
-
 Bulgaria
-
 Cambodia
-
 Cameroon
-
 Canada
-
 Chile
-
 China
-
 Colombia
-
 Congo
-
 Costa Rica
-
 Cote d'Ivoire
-
 Croatia
-
 Cuba
-
 Cyprus
-
 Czechia
-
 DR Congo
-
 Denmark
-
 Dominican Republic
-
 Ecuador
-
 Egypt
-
 El Salvador
-
 Estonia
-
 Eswatini
-
 Ethiopia
-
 Finland
-
 France
-
 Georgia
-
 Germany
-
 Ghana
-
 Greece
-
 Haiti
-
 Hong Kong
-
 Hungary
-
 India
-
 Indonesia
-
 Iran, Islamic republic
-
 Iraq
-
 Ireland
-
 Israel
-
 Italy
-
 Jamaica
-
 Japan
-
 Jordan
-
 Kazakhstan
-
 Kenya
-
 Korea
-
 Kuwait
-
 Kyrgyzstan
-
 Laos
-
 Latvia
-
 Lebanon
-
 Lesotho
-
 Libya
-
 Lithuania
-
 Luxembourg
-
 Madagascar
-
 Malaysia
-
 Malta
-
 Mauritius
-
 Mexico
-
 Moldova
-
 Mongolia
-
 Montenegro
-
 Morocco
-
 Mozambique
-
 Myanmar
-
 Namibia
-
 Nepal
-
 Netherlands
-
 New Zealand
-
 Nigeria
-
 North Macedonia
-
 Norway
-
 Oman
-
 Pakistan
-
 Palestine
-
 Panama
-
 Papua New Guinea
-
 Paraguay
-
 Peru
-
 Philippines
-
 Poland
-
 Portugal
-
 Puerto Rico
-
 Qatar
-
 Reunion
-
 Romania
-
 Rwanda
-
 Saudi Arabia
-
 Serbia
-
 Singapore
-
 Slovakia
-
 Slovenia
-
 Somalia
-
 South Africa
-
 Spain
-
 Sri Lanka
-
 Sweden
-
 Switzerland
-
 Syria
-
 Taiwan
-
 Tajikistan
-
 Tanzania
-
 Thailand
-
 Trinidad and Tobago
-
 Tunisia
-
 Turkey
-
 UAE
-
 Uganda
-
 Ukraine
-
 United Kingdom
-
United States
-
 Uruguay
-
 Uzbekistan
-
 Venezuela
-
 Vietnam
-
 Yemen
-
 Zambia
-
 Zimbabwe
- Forex
- Crypto












