

Will Interactive Brokers stock hold $75.76 support as sellers dominate trend?

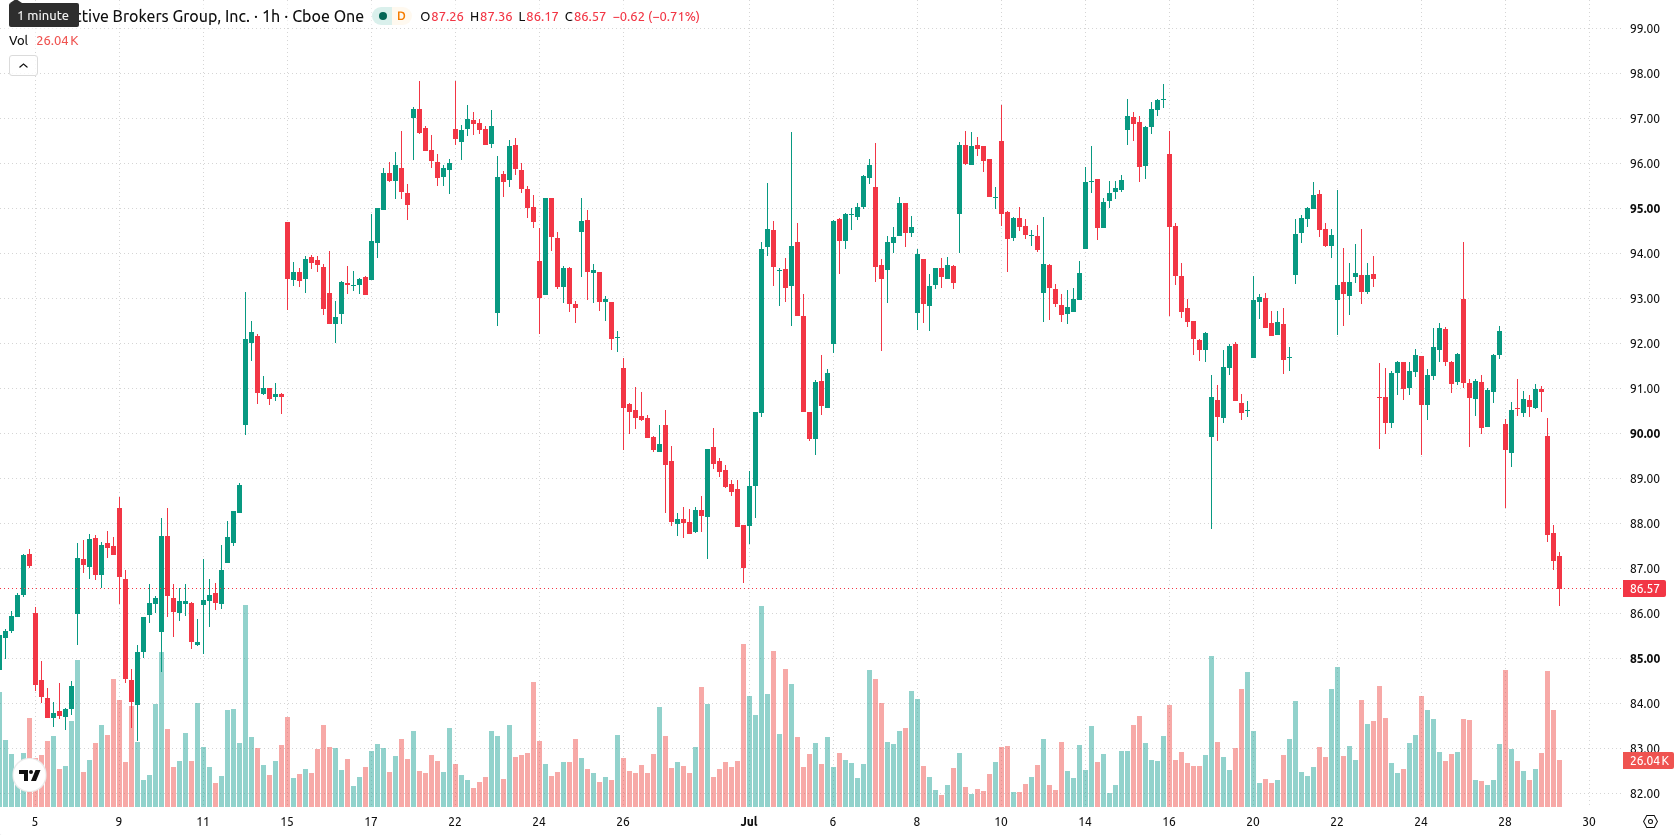
Interactive Brokers Group (IBKR) stock is trading at $86.41, having declined 4.95% today. The move leaves the price below its key short- and medium-term moving averages, while it remains above its long-term average.
 83.70
85.02
Highlights
- Interactive Brokers expanded AI integration across its trading platforms, improving accessibility and automation for client accounts.
- These technology upgrades strengthen operational capabilities, though the stock remains pressured by broader market selling.
- IBKR faces pronounced bearish momentum with strong selling signals and a projected trading range of $83.49–$89.06, favoring further downside.
Operational profile improves as technology upgrades meet demand
Interactive Brokers has expanded its Model Context Protocol, allowing clients to integrate their brokerage accounts with a wider range of AI platforms across solutions such as Client Portal, IBKR Desktop, IBKR GlobalTrader, IBKR Mobile, and Trader Workstation, according to Investing.com. This development enhances user accessibility and supports growing demand for automation and advanced analytics in brokerage services. Such technology-driven upgrades may strengthen the company's operational profile and address evolving client needs, though price action has remained under broader selling pressure.
Sustained selling pressure as momentum signals align bearish
IBKR faced resistance at the Ichimoku Kijun level of $90.61, with the stock trading below its MA-20 ($90.42) and MA-50 ($91.78) on the h1 chart, while the MA-200 at $75.76 serves as a deeper support level. Momentum indicators highlight continued selling pressure: MACD signals Sell, ADX points to a bearish trend, and the RSI stands at 33.11, joined by Stoch RSI, CCI, and Bull/Bear Power all indicating an oversold or seller-dominant state. The Awesome Oscillator further reinforces the prevailing downtrend, and price action today featured a sharp drop with a gap down and a close near intraday lows on elevated volatility.
Downside risk elevated as volatility points to rangebound scenario
Over the short term, the expected trading range for IBKR is $83.49–$89.06, reflecting the typical volatility band relative to current levels. Probabilities favor further downside, with a 78% likelihood for continued weakness and only a 22% chance of an upside reversal. The baseline scenario projects rangebound action between support and resistance, with any breakout above immediate resistance at $90.61 opening potential for a short-term rebound, while a breakdown below support may lead to additional declines.
Previously it was reported that Interactive Brokers was demonstrating broad-based technical strength as investors anticipated robust earnings and positive price momentum. The current retracement below key moving averages and persistent selling signals a shift to a more cautious environment, with traders advised to monitor the $83.49–$89.06 range as volatility remains elevated and downside risks prevail.






Latest Interactive Brokers News




-
 Afghanistan
-
 Albania
-
 Algeria
-
 Angola
-
 Argentina
-
 Armenia
-
 Australia
-
 Austria
-
 Azerbaijan
-
 Bahamas
-
 Bahrain
-
 Bangladesh
-
 Belarus
-
 Belgium
-
 Bolivia
-
 Botswana
-
 Brazil
-
 Brunei
-
 Bulgaria
-
 Cambodia
-
 Cameroon
-
 Canada
-
 Chile
-
 China
-
 Colombia
-
 Congo
-
 Costa Rica
-
 Cote d'Ivoire
-
 Croatia
-
 Cuba
-
 Cyprus
-
 Czechia
-
 DR Congo
-
 Denmark
-
 Dominican Republic
-
 Ecuador
-
 Egypt
-
 El Salvador
-
 Estonia
-
 Eswatini
-
 Ethiopia
-
 Finland
-
 France
-
 Georgia
-
 Germany
-
 Ghana
-
 Greece
-
 Haiti
-
 Hong Kong
-
 Hungary
-
 India
-
 Indonesia
-
 Iran, Islamic republic
-
 Iraq
-
 Ireland
-
 Israel
-
 Italy
-
 Jamaica
-
 Japan
-
 Jordan
-
 Kazakhstan
-
 Kenya
-
 Korea
-
 Kuwait
-
 Kyrgyzstan
-
 Laos
-
 Latvia
-
 Lebanon
-
 Lesotho
-
 Libya
-
 Lithuania
-
 Luxembourg
-
 Madagascar
-
 Malaysia
-
 Malta
-
 Mauritius
-
 Mexico
-
 Moldova
-
 Mongolia
-
 Montenegro
-
 Morocco
-
 Mozambique
-
 Myanmar
-
 Namibia
-
 Nepal
-
 Netherlands
-
 New Zealand
-
 Nigeria
-
 North Macedonia
-
 Norway
-
 Oman
-
 Pakistan
-
 Palestine
-
 Panama
-
 Papua New Guinea
-
 Paraguay
-
 Peru
-
 Philippines
-
 Poland
-
 Portugal
-
 Puerto Rico
-
 Qatar
-
 Reunion
-
 Romania
-
 Rwanda
-
 Saudi Arabia
-
 Serbia
-
 Singapore
-
 Slovakia
-
 Slovenia
-
 Somalia
-
 South Africa
-
 Spain
-
 Sri Lanka
-
 Sweden
-
 Switzerland
-
 Syria
-
 Taiwan
-
 Tajikistan
-
 Tanzania
-
 Thailand
-
 Trinidad and Tobago
-
 Tunisia
-
 Turkey
-
 UAE
-
 Uganda
-
 Ukraine
-
 United Kingdom
-
United States
-
 Uruguay
-
 Uzbekistan
-
 Venezuela
-
 Vietnam
-
 Yemen
-
 Zambia
-
 Zimbabwe
- Forex
- Crypto












