

Interactive Brokers stock falls amid continued pressure below key moving averages

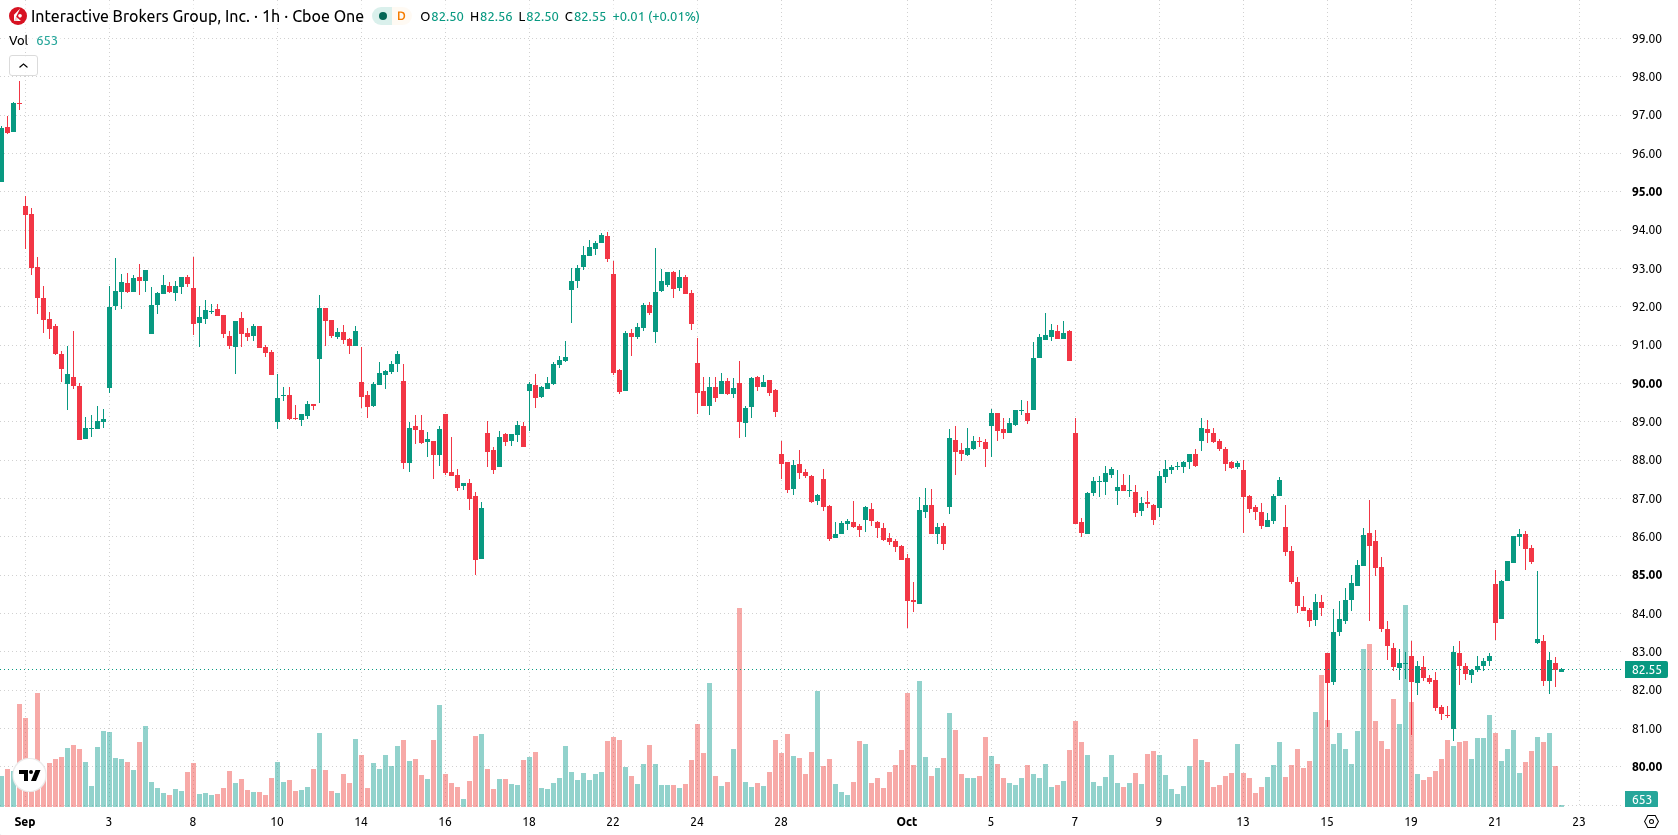
Interactive Brokers (IBKR) stock is trading at $82.48, down 3.34% on the day and closing near its session low. The move leaves the shares below their key moving averages, signaling ongoing pressure within a moderately volatile session.
 83.70
85.02
Highlights
- Interactive Brokers Group introduced the IBKR Autonomous Trading platform, allowing eligible clients to deploy custom AI-driven trading strategies.
- Clients can allocate funds to a dedicated AI trading account and define personalized trading and risk settings.
- Shares of Interactive Brokers trade below key moving averages, with downside momentum dominating and an expected price range of $79.74 to $85.22 in the next 2 to 3 days.
Automated trading launch expands platform amid persistent selling pressure
Interactive Brokers Group Inc has launched its IBKR Autonomous Trading platform, an AI-powered feature enabling eligible clients to delegate market monitoring and trade execution to connected artificial intelligence platforms, according to Gurufocus. This rollout allows clients to fund an AI-specific account partition and define custom trading strategies and risk parameters, enhancing the platform’s value proposition. While this development broadens Interactive Brokers’ automated trading capabilities and could drive future client engagement, price action has remained under broader selling pressure.
Mixed technical momentum as Kijun barrier limits upside
IBKR is trading below both the MA-20 and MA-50 on the hourly chart, as well as under the MA-200 on the daily timeframe, placing the Kijun (Ichimoku) resistance at $83.42 as a critical near-term barrier. Momentum indicators paint a mixed technical landscape: MACD shows a buy signal, but ADX issues a sell. RSI stands at 55.3 (buy), while Stoch RSI and CCI both register as neutral. Bull/Bear Power is oversold, pointing to seller dominance on an intraday basis, though the Awesome Oscillator remains neutral. The drop in price was accompanied by a session gap of $2.09 and moderate volatility, suggesting that intraday weakness currently outweighs any nascent bullish momentum.
Downside risk favored as gap persists within forecast range
Over the next two to three trading days, IBKR is likely to consolidate within a $79.74 to $85.22 range, reflecting typical volatility relative to current levels. The probability of a move higher is limited to 21%, with a downside move viewed as more likely under present technical conditions. A break above the Kijun resistance at $83.42 would open a possible bullish scenario, while a close below forecasted support could trigger further declines.
Previously it was reported that the launch of IBKR Autonomous Trading marked a key expansion in Interactive Brokers’ automation strategy, positioning the firm for potential competitive gains. The current price action, however, reveals mounting technical pressure and flags the $83.42 Kijun resistance as a critical level that traders should monitor for any signs of a reversal or further downside.






Latest Interactive Brokers News





-
 Afghanistan
-
 Albania
-
 Algeria
-
 Angola
-
 Argentina
-
 Armenia
-
 Australia
-
 Austria
-
 Azerbaijan
-
 Bahamas
-
 Bahrain
-
 Bangladesh
-
 Belarus
-
 Belgium
-
 Bolivia
-
 Botswana
-
 Brazil
-
 Brunei
-
 Bulgaria
-
 Cambodia
-
 Cameroon
-
 Canada
-
 Chile
-
 China
-
 Colombia
-
 Congo
-
 Costa Rica
-
 Cote d'Ivoire
-
 Croatia
-
 Cuba
-
 Cyprus
-
 Czechia
-
 DR Congo
-
 Denmark
-
 Dominican Republic
-
 Ecuador
-
 Egypt
-
 El Salvador
-
 Estonia
-
 Eswatini
-
 Ethiopia
-
 Finland
-
 France
-
 Georgia
-
 Germany
-
 Ghana
-
 Greece
-
 Haiti
-
 Hong Kong
-
 Hungary
-
 India
-
 Indonesia
-
 Iran, Islamic republic
-
 Iraq
-
 Ireland
-
 Israel
-
 Italy
-
 Jamaica
-
 Japan
-
 Jordan
-
 Kazakhstan
-
 Kenya
-
 Korea
-
 Kuwait
-
 Kyrgyzstan
-
 Laos
-
 Latvia
-
 Lebanon
-
 Lesotho
-
 Libya
-
 Lithuania
-
 Luxembourg
-
 Madagascar
-
 Malaysia
-
 Malta
-
 Mauritius
-
 Mexico
-
 Moldova
-
 Mongolia
-
 Montenegro
-
 Morocco
-
 Mozambique
-
 Myanmar
-
 Namibia
-
 Nepal
-
 Netherlands
-
 New Zealand
-
 Nigeria
-
 North Macedonia
-
 Norway
-
 Oman
-
 Pakistan
-
 Palestine
-
 Panama
-
 Papua New Guinea
-
 Paraguay
-
 Peru
-
 Philippines
-
 Poland
-
 Portugal
-
 Puerto Rico
-
 Qatar
-
 Reunion
-
 Romania
-
 Rwanda
-
 Saudi Arabia
-
 Serbia
-
 Singapore
-
 Slovakia
-
 Slovenia
-
 Somalia
-
 South Africa
-
 Spain
-
 Sri Lanka
-
 Sweden
-
 Switzerland
-
 Syria
-
 Taiwan
-
 Tajikistan
-
 Tanzania
-
 Thailand
-
 Trinidad and Tobago
-
 Tunisia
-
 Turkey
-
 UAE
-
 Uganda
-
 Ukraine
-
 United Kingdom
-
United States
-
 Uruguay
-
 Uzbekistan
-
 Venezuela
-
 Vietnam
-
 Yemen
-
 Zambia
-
 Zimbabwe
- Forex
- Crypto












