

Starlink mobile launch pressures Verizon stock price below $44.45 support

Verizon (VZ) stock is trading at $45.38 after a daily loss of 3.17%. The shares have moved lower and are now positioned below key short- and medium-term moving averages, while remaining above their long-term trend level.
 45.94
47.03
Highlights
- SpaceX's plan to launch full-scale Starlink mobile services targets Verizon's customer base, intensifying competition in wireless markets.
- Lower Treasury yields have increased the appeal of dividend-paying telecom stocks, but competitive pressures from Starlink have negatively impacted sentiment on Verizon shares.
- Verizon stock faces short- and medium-term selling pressure with a 67% probability of trading in a $44.45 to $47.43 range over the next few days.
Starlink expansion intensifies competitive pressure despite supportive yields
SpaceX's announcement of plans to introduce a full-scale mobile service through Starlink, targeting Verizon's core customer base, has emerged as a significant competitive development, according to Streetinsider and Marketscreener. This expansion by SpaceX adds direct pressure to Verizon's wireless business, driving investor concerns over future market share and growth prospects. In addition, lower Treasury yields have recently improved the outlook for dividend-paying telecom stocks by reducing borrowing costs and enhancing the appeal of reliable dividend income, as noted by Kalkinemedia. The competitive threat from Starlink has weighed more heavily on sentiment around Verizon shares.
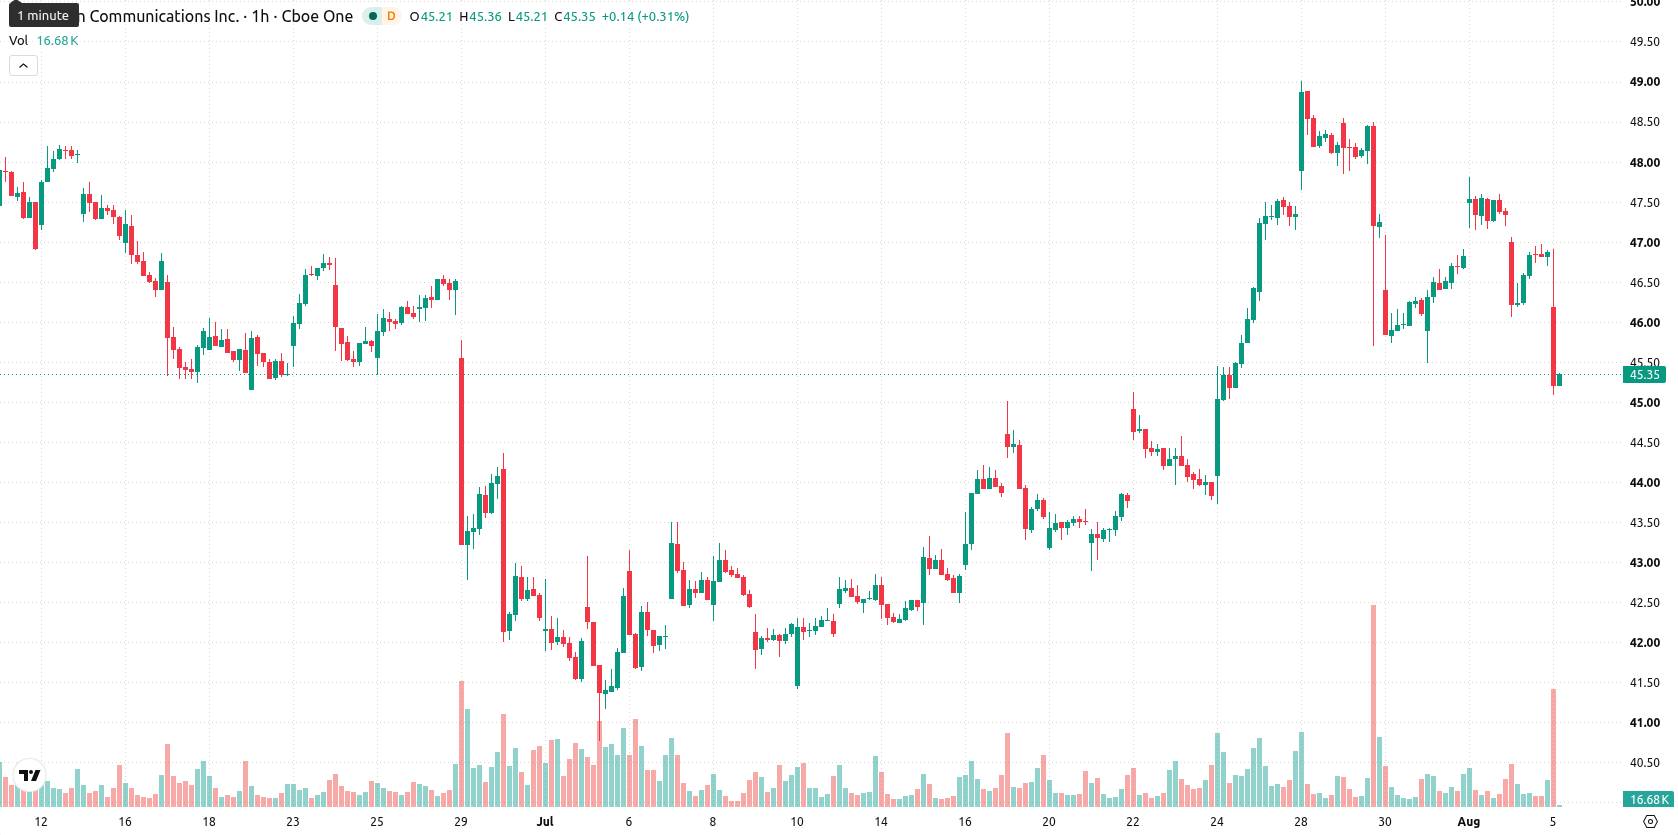
Technical resistance and oversold signals reinforce downside momentum
On the technical front, VZ is trading below its MA-20 and MA-50 on the active timeframe, indicating notable short- and medium-term resistance. The price remains above the MA-200 (daily), while the Ichimoku Kijun at $46.64 marks an immediate resistance level. MACD has generated a Sell signal, and ADX is Neutral. Momentum signals including RSI, Stoch RSI, CCI, and Bull/Bear Power all point to oversold conditions and dominant selling activity intraday. The Awesome Oscillator is Neutral. The stock ended the session near its low and exhibited moderate volatility, consistent with strong downside follow-through.
Further declines favored as price remains within defined range
Over the next two to three sessions, VZ is expected to fluctuate within a $44.45 to $47.43 range, with a 67% likelihood of further declines and only a 33% probability of a rebound. The baseline scenario calls for the price to remain inside this corridor. A breakout above $46.64 would be required to spark a short-term rebound, while a decline below $44.45 would increase the risk of additional downside.
Earlier, analysts noted that Verizon had entered a period of bullish momentum tempered by overbought technical conditions, suggesting a need for confirmation of sustained gains. The latest price breakdown below short- and medium-term averages in response to increased competitive pressures from SpaceX's Starlink marks a shift to heightened downside risk, with the $44.45 level now serving as a critical threshold for further declines.









-
 Afghanistan
-
 Albania
-
 Algeria
-
 Angola
-
 Argentina
-
 Armenia
-
 Australia
-
 Austria
-
 Azerbaijan
-
 Bahamas
-
 Bahrain
-
 Bangladesh
-
 Belarus
-
 Belgium
-
 Bolivia
-
 Botswana
-
 Brazil
-
 Brunei
-
 Bulgaria
-
 Cambodia
-
 Cameroon
-
 Canada
-
 Chile
-
 China
-
 Colombia
-
 Congo
-
 Costa Rica
-
 Cote d'Ivoire
-
 Croatia
-
 Cuba
-
 Cyprus
-
 Czechia
-
 DR Congo
-
 Denmark
-
 Dominican Republic
-
 Ecuador
-
 Egypt
-
 El Salvador
-
 Estonia
-
 Eswatini
-
 Ethiopia
-
 Finland
-
 France
-
 Georgia
-
 Germany
-
 Ghana
-
 Greece
-
 Haiti
-
 Hong Kong
-
 Hungary
-
 India
-
 Indonesia
-
 Iran, Islamic republic
-
 Iraq
-
 Ireland
-
 Israel
-
 Italy
-
 Jamaica
-
 Japan
-
 Jordan
-
 Kazakhstan
-
 Kenya
-
 Korea
-
 Kuwait
-
 Kyrgyzstan
-
 Laos
-
 Latvia
-
 Lebanon
-
 Lesotho
-
 Libya
-
 Lithuania
-
 Luxembourg
-
 Madagascar
-
 Malaysia
-
 Malta
-
 Mauritius
-
 Mexico
-
 Moldova
-
 Mongolia
-
 Montenegro
-
 Morocco
-
 Mozambique
-
 Myanmar
-
 Namibia
-
 Nepal
-
 Netherlands
-
 New Zealand
-
 Nigeria
-
 North Macedonia
-
 Norway
-
 Oman
-
 Pakistan
-
 Palestine
-
 Panama
-
 Papua New Guinea
-
 Paraguay
-
 Peru
-
 Philippines
-
 Poland
-
 Portugal
-
 Puerto Rico
-
 Qatar
-
 Reunion
-
 Romania
-
 Rwanda
-
 Saudi Arabia
-
 Serbia
-
 Singapore
-
 Slovakia
-
 Slovenia
-
 Somalia
-
 South Africa
-
 Spain
-
 Sri Lanka
-
 Sweden
-
 Switzerland
-
 Syria
-
 Taiwan
-
 Tajikistan
-
 Tanzania
-
 Thailand
-
 Trinidad and Tobago
-
 Tunisia
-
 Turkey
-
 UAE
-
 Uganda
-
 Ukraine
-
 United Kingdom
-
United States
-
 Uruguay
-
 Uzbekistan
-
 Venezuela
-
 Vietnam
-
 Yemen
-
 Zambia
-
 Zimbabwe
- Forex
- Crypto












