

Robotaxis deployment plan lifts Uber stock toward $77.59 resistance

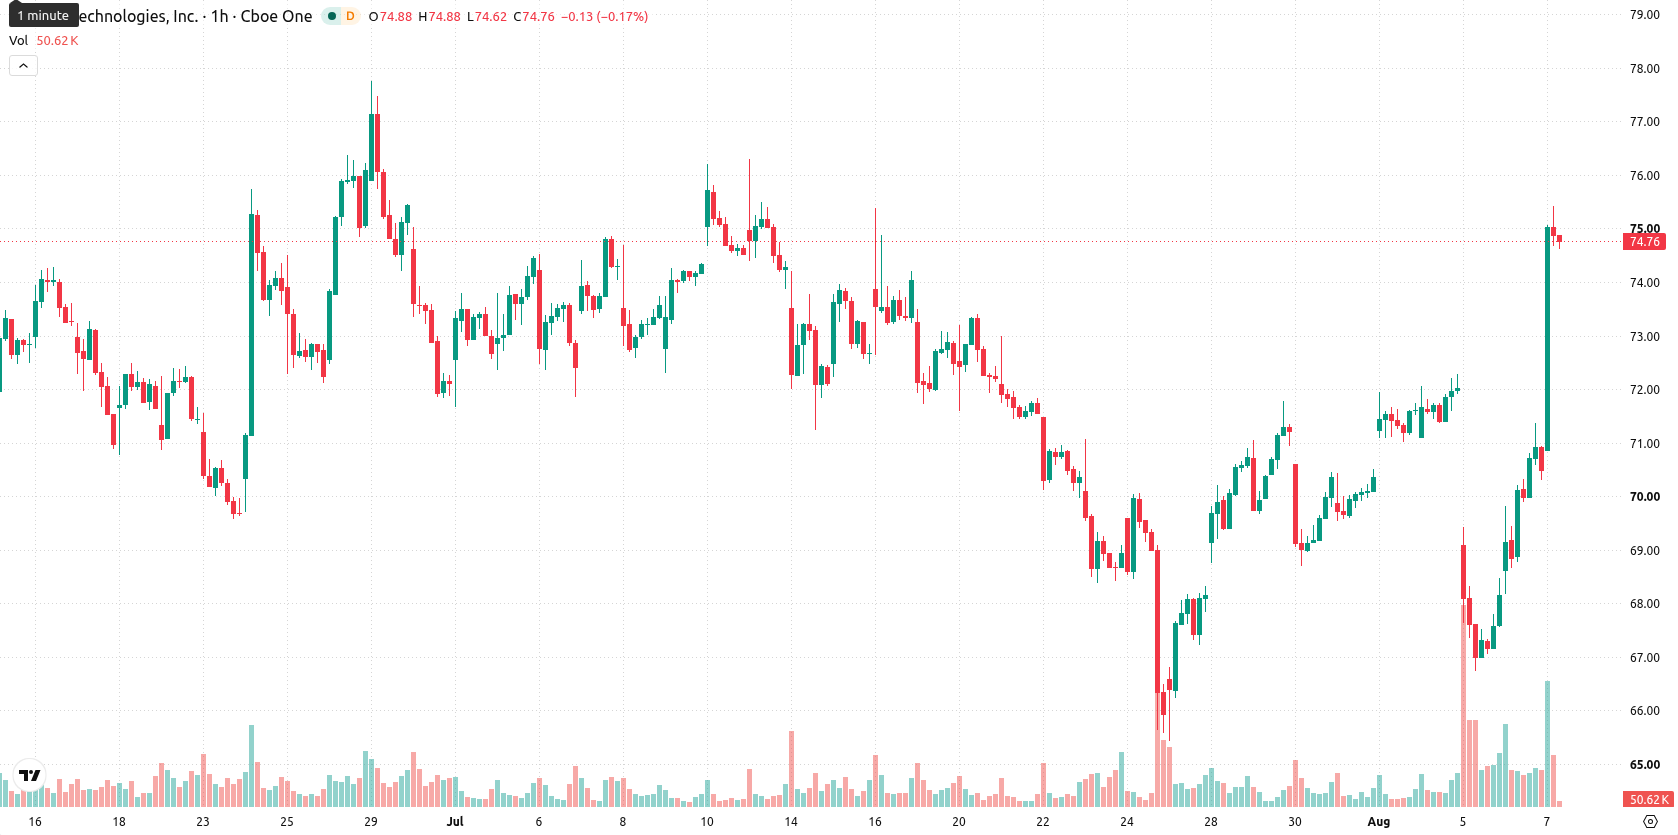
Shares of Uber Technologies, Inc. (UBER) are trading at $75.11, advancing 6.58% on the day. The stock sits above its key short- and medium-term moving averages but remains below longer-term averages.
 65.66
66.82
Highlights
- Uber stock gains are fueled by strong second-quarter gross bookings above analyst estimates, driven by robust mobility and airport demand.
- The company maintains significant balance sheet strength with $2.79 billion in recent free cash flow and plans $10 billion toward deploying 120,000 robotaxis.
- Bullish momentum persists with shares trading near session highs and a 74% probability of moving within the $72.63 to $77.59 range, though overbought signals suggest caution.
Earnings-driven momentum as mobility and robotaxi plans boost sentiment
Uber's strong second-quarter earnings, with gross bookings surpassing analyst estimates on the back of sustained growth in its mobility segment and elevated airport and corporate commuting demand, highlight underlying operational momentum and are driving current buying interest, according to Tradingkey. The company also posted $14.19 billion in revenue for the quarter, reflecting a 12% year-over-year increase, even though this narrowly missed consensus projections, as noted by Benzinga. Meanwhile, Uber has bolstered its future positioning through plans to deploy 120,000 robotaxis across 15 cities, allocating $10 billion in capital spending to expand its autonomous vehicle partnerships, with recent free cash flow of $2.79 billion and over $10 billion on a trailing basis providing significant balance sheet strength as reported by Techspot and Ts2.
Bullish signals capped by long-term resistance and overbought warnings
Technically, UBER is trading above the MA-20 at $69.98 and MA-50 at $70.31, but remains capped by the MA-200 at $78.12 as a key long-term resistance. The Ichimoku Kijun offers immediate support at $71.04. Indicators show MACD, ADX, and Awesome Oscillator are aligned bullishly, while RSI at 72.97, CCI, Stochastic RSI, and Bull/Bear Power all flag overbought conditions. Bull/Bear Power further confirms intraday buyer dominance, but the cluster of overbought oscillator readings advises near-term caution against aggressive continuation plays.
Upside bias as consolidation likely within defined range
In the short term, UBER is expected to trade within a typical volatility range of $72.63 to $77.59. There is a high probability (74%) for further upside, making a downward correction less likely in the near term. If current support holds, price action may consolidate within this corridor before a move to new highs. A breakout above $77.59 would open the path to further gains, while a dip below $72.63 would signal a short-term reversal.
Earlier, analysts noted that Uber's rally was showing signs of technical caution amid mixed momentum signals and uncertainty about the sustainability of recent gains. With current technicals now confirming both sustained bullish momentum and overbought conditions, traders should closely monitor the $77.59 breakout level for potential further upside or a reversal if price fails to advance beyond this resistance.









-
 Afghanistan
-
 Albania
-
 Algeria
-
 Angola
-
 Argentina
-
 Armenia
-
 Australia
-
 Austria
-
 Azerbaijan
-
 Bahamas
-
 Bahrain
-
 Bangladesh
-
 Belarus
-
 Belgium
-
 Bolivia
-
 Botswana
-
 Brazil
-
 Brunei
-
 Bulgaria
-
 Cambodia
-
 Cameroon
-
 Canada
-
 Chile
-
 China
-
 Colombia
-
 Congo
-
 Costa Rica
-
 Cote d'Ivoire
-
 Croatia
-
 Cuba
-
 Cyprus
-
 Czechia
-
 DR Congo
-
 Denmark
-
 Dominican Republic
-
 Ecuador
-
 Egypt
-
 El Salvador
-
 Estonia
-
 Eswatini
-
 Ethiopia
-
 Finland
-
 France
-
 Georgia
-
 Germany
-
 Ghana
-
 Greece
-
 Haiti
-
 Hong Kong
-
 Hungary
-
 India
-
 Indonesia
-
 Iran, Islamic republic
-
 Iraq
-
 Ireland
-
 Israel
-
 Italy
-
 Jamaica
-
 Japan
-
 Jordan
-
 Kazakhstan
-
 Kenya
-
 Korea
-
 Kuwait
-
 Kyrgyzstan
-
 Laos
-
 Latvia
-
 Lebanon
-
 Lesotho
-
 Libya
-
 Lithuania
-
 Luxembourg
-
 Madagascar
-
 Malaysia
-
 Malta
-
 Mauritius
-
 Mexico
-
 Moldova
-
 Mongolia
-
 Montenegro
-
 Morocco
-
 Mozambique
-
 Myanmar
-
 Namibia
-
 Nepal
-
 Netherlands
-
 New Zealand
-
 Nigeria
-
 North Macedonia
-
 Norway
-
 Oman
-
 Pakistan
-
 Palestine
-
 Panama
-
 Papua New Guinea
-
 Paraguay
-
 Peru
-
 Philippines
-
 Poland
-
 Portugal
-
 Puerto Rico
-
 Qatar
-
 Reunion
-
 Romania
-
 Rwanda
-
 Saudi Arabia
-
 Serbia
-
 Singapore
-
 Slovakia
-
 Slovenia
-
 Somalia
-
 South Africa
-
 Spain
-
 Sri Lanka
-
 Sweden
-
 Switzerland
-
 Syria
-
 Taiwan
-
 Tajikistan
-
 Tanzania
-
 Thailand
-
 Trinidad and Tobago
-
 Tunisia
-
 Turkey
-
 UAE
-
 Uganda
-
 Ukraine
-
 United Kingdom
-
United States
-
 Uruguay
-
 Uzbekistan
-
 Venezuela
-
 Vietnam
-
 Yemen
-
 Zambia
-
 Zimbabwe
- Forex
- Crypto












