

Amazon stock weekly forecast: Rangebound setup holds as traders eye support and resistance levels

Shares of Amazon.com, Inc. (AMZN) are trading near $274 as a post-earnings recovery holds up despite a stretched technical picture this week. Recent gains have cooled, and the setup now faces renewed caution as investors weigh follow-through potential versus signals of short-term exhaustion.
 253.77
255.18
Highlights
- Shares of Amazon remain above key support levels and above the 20-day and 50-day moving averages, maintaining a bullish long-term structure.
- Short-term indicators show overbought conditions with developing divergence in momentum, suggesting potential for a near-term pullback that is not yet confirmed.
- Amazon stock is expected to consolidate within $268.79 to $286.51, with resistance at $282.79 and support at $270.73.
AI-fueled sales surge offset by insider selling this week
Amazon reported strong second-quarter 2026 results, with net sales of $200.6 billion and AWS revenue up 37% to $42.2 billion, both exceeding Wall Street expectations, according to Futurum Group. The company's market capitalization briefly topped $3 trillion after earnings, with growth powered by new AI and cloud infrastructure partnerships, as highlighted by Yahoo Finance and Seeking Alpha. Significant insider selling from Jeff Bezos and higher AI-related investment costs, covered by sources including GuruFocus and TradingKey, have since introduced some downward pressure and a more cautious outlook heading into the week.
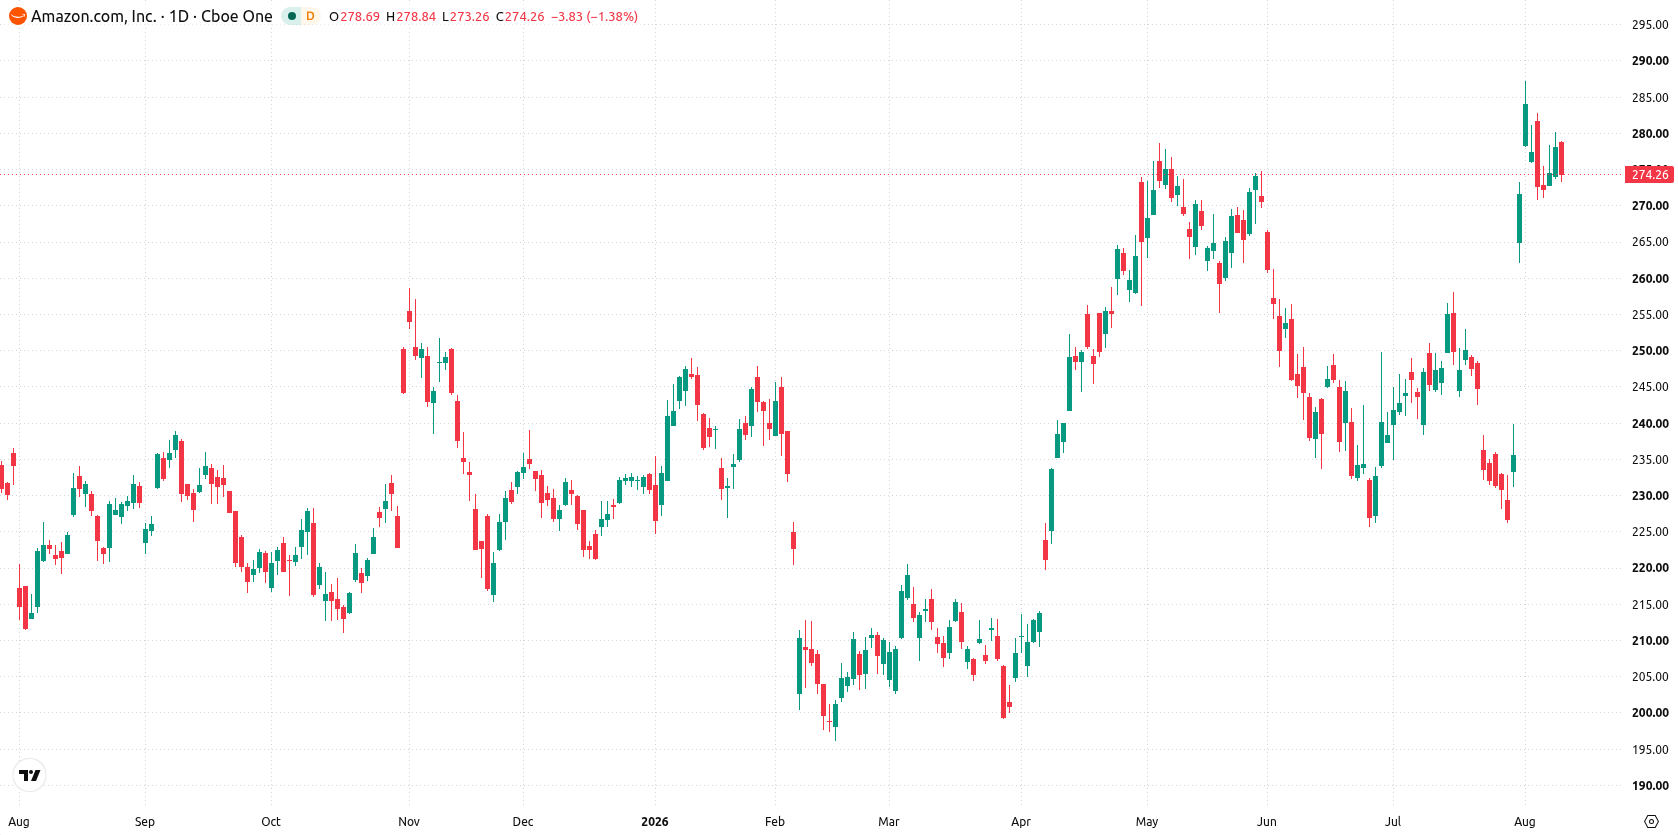
Bullish momentum wavers as overbought signals emerge during the week
The daily chart shows a developing trend with volatility at 4.45%, but momentum signals are diverging. RSI is at 65.58 and approaching overbought territory, while CCI and Stochastic RSI have both entered the overbought zone, pointing to stretched short-term conditions even as MACD remains firmly bullish. Key support lies at $270.73, reinforced by the Ichimoku Kijun at $256.68, while resistance is defined by the recent high at $282.79. The momentum character suggests an emerging move lower that is not yet confirmed, so trader positioning should be nimble.
Consolidation base expected amid breakout risk next week
In the week ahead, Amazon shares are expected to trade between $268.79 and $286.51. There is a 76% probability of an increase and a 24% chance of a decrease. The base case calls for consolidation within this range, with upside potential if the stock can break through resistance at $282.79 and a more pronounced pullback if support at $270.73 gives way.
Earlier, analysts noted that a record U.S. stock rally had prompted profit-taking and more defensive positioning as investors awaited labor market data for cues on Federal Reserve policy. The current technical setup for Amazon adds a new dimension, as the combination of stretched momentum indicators and strong recent gains points to $270.73 as a critical support level to monitor for any potential shift in trend.











-
 Afghanistan
-
 Albania
-
 Algeria
-
 Angola
-
 Argentina
-
 Armenia
-
 Australia
-
 Austria
-
 Azerbaijan
-
 Bahamas
-
 Bahrain
-
 Bangladesh
-
 Belarus
-
 Belgium
-
 Bolivia
-
 Botswana
-
 Brazil
-
 Brunei
-
 Bulgaria
-
 Cambodia
-
 Cameroon
-
 Canada
-
 Chile
-
 China
-
 Colombia
-
 Congo
-
 Costa Rica
-
 Cote d'Ivoire
-
 Croatia
-
 Cuba
-
 Cyprus
-
 Czechia
-
 DR Congo
-
 Denmark
-
 Dominican Republic
-
 Ecuador
-
 Egypt
-
 El Salvador
-
 Estonia
-
 Eswatini
-
 Ethiopia
-
 Finland
-
 France
-
 Georgia
-
 Germany
-
 Ghana
-
 Greece
-
 Haiti
-
 Hong Kong
-
 Hungary
-
 India
-
 Indonesia
-
 Iran, Islamic republic
-
 Iraq
-
 Ireland
-
 Israel
-
 Italy
-
 Jamaica
-
 Japan
-
 Jordan
-
 Kazakhstan
-
 Kenya
-
 Korea
-
 Kuwait
-
 Kyrgyzstan
-
 Laos
-
 Latvia
-
 Lebanon
-
 Lesotho
-
 Libya
-
 Lithuania
-
 Luxembourg
-
 Madagascar
-
 Malaysia
-
 Malta
-
 Mauritius
-
 Mexico
-
 Moldova
-
 Mongolia
-
 Montenegro
-
 Morocco
-
 Mozambique
-
 Myanmar
-
 Namibia
-
 Nepal
-
 Netherlands
-
 New Zealand
-
 Nigeria
-
 North Macedonia
-
 Norway
-
 Oman
-
 Pakistan
-
 Palestine
-
 Panama
-
 Papua New Guinea
-
 Paraguay
-
 Peru
-
 Philippines
-
 Poland
-
 Portugal
-
 Puerto Rico
-
 Qatar
-
 Reunion
-
 Romania
-
 Rwanda
-
 Saudi Arabia
-
 Serbia
-
 Singapore
-
 Slovakia
-
 Slovenia
-
 Somalia
-
 South Africa
-
 Spain
-
 Sri Lanka
-
 Sweden
-
 Switzerland
-
 Syria
-
 Taiwan
-
 Tajikistan
-
 Tanzania
-
 Thailand
-
 Trinidad and Tobago
-
 Tunisia
-
 Turkey
-
 UAE
-
 Uganda
-
 Ukraine
-
 United Kingdom
-
United States
-
 Uruguay
-
 Uzbekistan
-
 Venezuela
-
 Vietnam
-
 Yemen
-
 Zambia
-
 Zimbabwe
- Forex
- Crypto












