


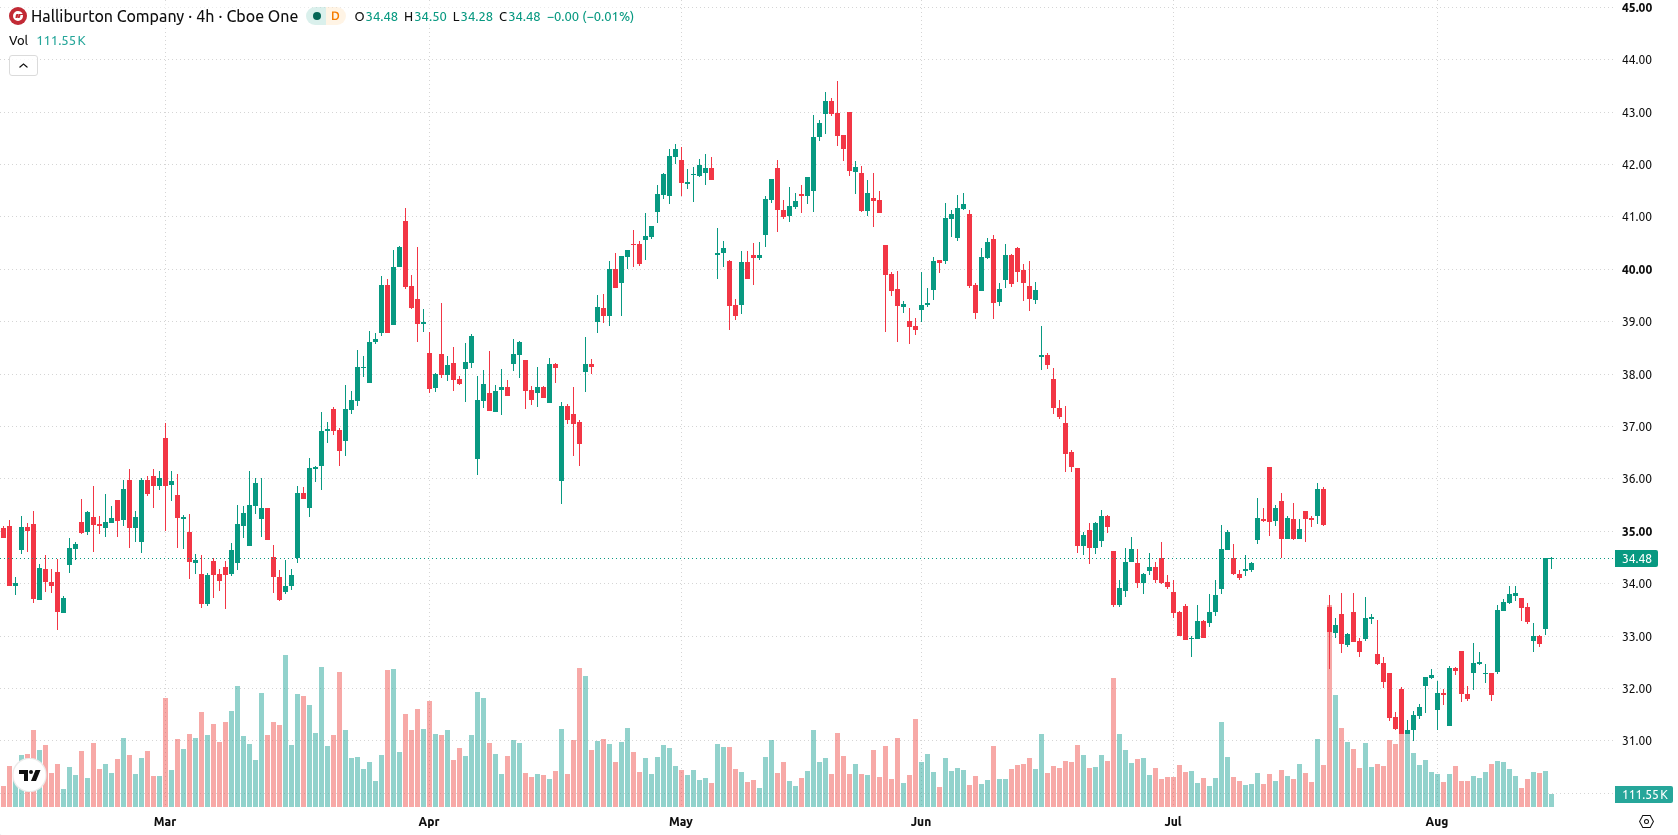
Halliburton Company (HAL) advanced 5.09% after continued recognition of its growth in strategic energy and technology projects reinforced demand. The move is supported by near-term bullish momentum as HAL trades above its 20-day and 200-day moving averages, though resistance at the 50-day moving average near $34.81 limits additional upside in the short term.
 36.51
36.51
Highlights
- Halliburton stock delivered a 94% five-year total return and trades at a 17.3x price-to-earnings ratio, below industry average.
- Earnings outlook depends on the execution of nuclear waste disposal and AI data center projects, with further upside tied to improved market recognition.
- Shares traded near session highs with strong intraday price gains, but weak momentum signals and technical resistance indicate a high probability of range-bound or lower moves between $33.65 and $35.87 over the next five days.
Shareholder gains as project execution fuels undervaluation case
Halliburton has delivered a nearly 94% return for shareholders over the last five years and remains valued at a price-to-earnings ratio of 17.3x, well below industry averages. The company's competitive positioning is driven by strong fundamentals and its progress in projects such as nuclear waste disposal partnerships and AI data center initiatives. The future outlook depends on continued execution of these complex projects and greater market recognition of its financial performance.
Mixed momentum emerges as technical boundaries confine movement
HAL is trading above the 20-day moving average at $32.76 and the 200-day moving average at $34.12, but is just below the 50-day moving average at $34.81. This configuration signals a short-term bullish bias, with resistance at $34.81 and support at $34.5. Momentum signals are mixed: the MACD and ADX both reflect weak or declining momentum, while the RSI stands at 46.51 and issues a sell signal, indicating no overbought conditions. The Stochastic RSI at 74.66 and CCI at 10.68 are both neutral. Intraday, the Bull/Bear Power at 0.39 shows buyers dominating, and notable strength toward session highs is observed, though overall momentum readings point to lingering caution.
Earlier, analysts noted that Halliburton's sustained strength above key technical levels had turned the outlook bullish, with expectations for continued consolidation. The current analysis adds a more cautious perspective, highlighting an increased probability of a downside move and advising traders to monitor $34.5 as a critical support level in the coming sessions.






Latest Halliburton Company News





-
 Afghanistan
-
 Albania
-
 Algeria
-
 Angola
-
 Argentina
-
 Armenia
-
 Australia
-
 Austria
-
 Azerbaijan
-
 Bahamas
-
 Bahrain
-
 Bangladesh
-
 Belarus
-
 Belgium
-
 Bolivia
-
 Botswana
-
 Brazil
-
 Brunei
-
 Bulgaria
-
 Cambodia
-
 Cameroon
-
 Canada
-
 Chile
-
 China
-
 Colombia
-
 Congo
-
 Costa Rica
-
 Cote d'Ivoire
-
 Croatia
-
 Cuba
-
 Cyprus
-
 Czechia
-
 DR Congo
-
 Denmark
-
 Dominican Republic
-
 Ecuador
-
 Egypt
-
 El Salvador
-
 Estonia
-
 Eswatini
-
 Ethiopia
-
 Finland
-
 France
-
 Georgia
-
 Germany
-
 Ghana
-
 Greece
-
 Haiti
-
 Hong Kong
-
 Hungary
-
 India
-
 Indonesia
-
 Iran, Islamic republic
-
 Iraq
-
 Ireland
-
 Israel
-
 Italy
-
 Jamaica
-
 Japan
-
 Jordan
-
 Kazakhstan
-
 Kenya
-
 Korea
-
 Kuwait
-
 Kyrgyzstan
-
 Laos
-
 Latvia
-
 Lebanon
-
 Lesotho
-
 Libya
-
 Lithuania
-
 Luxembourg
-
 Madagascar
-
 Malaysia
-
 Malta
-
 Mauritius
-
 Mexico
-
 Moldova
-
 Mongolia
-
 Montenegro
-
 Morocco
-
 Mozambique
-
 Myanmar
-
 Namibia
-
 Nepal
-
 Netherlands
-
 New Zealand
-
 Nigeria
-
 North Macedonia
-
 Norway
-
 Oman
-
 Pakistan
-
 Palestine
-
 Panama
-
 Papua New Guinea
-
 Paraguay
-
 Peru
-
 Philippines
-
 Poland
-
 Portugal
-
 Puerto Rico
-
 Qatar
-
 Reunion
-
 Romania
-
 Rwanda
-
 Saudi Arabia
-
 Serbia
-
 Singapore
-
 Slovakia
-
 Slovenia
-
 Somalia
-
 South Africa
-
 Spain
-
 Sri Lanka
-
 Sweden
-
 Switzerland
-
 Syria
-
 Taiwan
-
 Tajikistan
-
 Tanzania
-
 Thailand
-
 Trinidad and Tobago
-
 Tunisia
-
 Turkey
-
 UAE
-
 Uganda
-
 Ukraine
-
 United Kingdom
-
United States
-
 Uruguay
-
 Uzbekistan
-
 Venezuela
-
 Vietnam
-
 Yemen
-
 Zambia
-
 Zimbabwe
- Forex
- Crypto












