


Persistent technical weakness drove Enphase Energy, Inc. (ENPH) down 4.43% today, as sellers dominated amid continued bearish momentum and lack of a fresh catalyst. The move is supported by ENPH trading below its major moving averages and sustained selling signals across key technical indicators.
 32.69
34.14
32.69
34.14
Highlights
- Shares of Enphase Energy fell 4.43% to $38.69, closing near the session low after opening below previous support.
- The stock trades below its 20-day, 50-day, and 200-day moving averages, with technical signals indicating ongoing bearish momentum.
- Expected trading range for the next five sessions is $37.02 to $40.35, with a 71% probability of further downside.
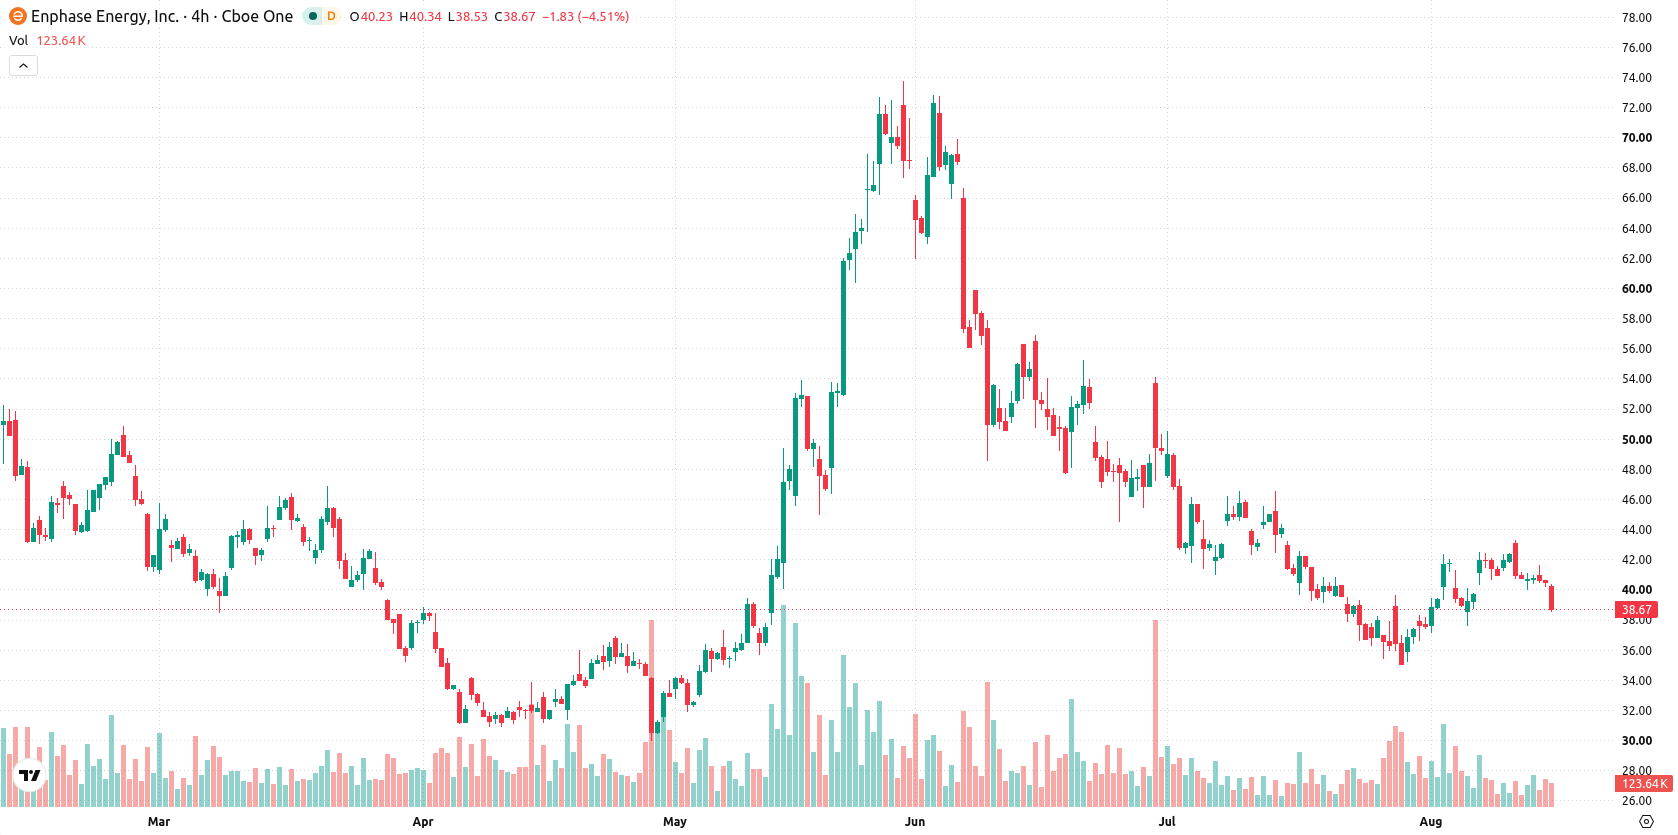
Sustained downside pressure as moving averages and signals turn bearish
ENPH is trading below its 20-day ($39.29), 50-day ($44.96), and 200-day ($40.23) moving averages, reflecting consistent downward pressure in short-, medium-, and long-term trends. Key support lies at $38.59, with immediate resistance at $39.29, while the bullish alignment of the 50-day versus the 200-day moving average points to some underlying trend resilience. Momentum indicators remain broadly negative, as the MACD issues a 'Strong Sell' signal and the ADX records weak trend strength. The RSI and Hull Moving Average confirm selling conditions, though the CCI is mildly bullish and Bull/Bear Power shows buyer dominance but signals an overbought state.
Previously it was reported that Enphase Energy's launch of the APS Storage Rewards pilot introduced an operational update, while technical factors suggested an inflection point for the stock. The current technical setup reinforces persistent weakness, and traders should closely monitor whether the high probability of further downside risk materializes if support at $38.59 fails.





Latest Enphase Energy News



-
 Afghanistan
-
 Albania
-
 Algeria
-
 Angola
-
 Argentina
-
 Armenia
-
 Australia
-
 Austria
-
 Azerbaijan
-
 Bahamas
-
 Bahrain
-
 Bangladesh
-
 Belarus
-
 Belgium
-
 Bolivia
-
 Botswana
-
 Brazil
-
 Brunei
-
 Bulgaria
-
 Cambodia
-
 Cameroon
-
 Canada
-
 Chile
Chile
-
 China
China
-
 Colombia
-
 Congo
Congo
-
 Costa Rica
-
 Cote d'Ivoire
-
 Croatia
-
 Cuba
Cuba
-
 Cyprus
-
 Czechia
-
 DR Congo
-
 Denmark
-
 Dominican Republic
-
 Ecuador
-
 Egypt
Egypt
-
 El Salvador
-
 Estonia
-
 Eswatini
-
 Ethiopia
-
 Finland
-
 France
-
 Georgia
-
 Germany
-
 Ghana
Ghana
-
 Greece
-
 Haiti
Haiti
-
 Hong Kong
-
 Hungary
-
 India
India
-
 Indonesia
-
 Iran, Islamic republic
-
 Iraq
Iraq
-
 Ireland
-
 Israel
-
 Italy
Italy
-
 Jamaica
-
 Japan
Japan
-
 Jordan
-
 Kazakhstan
-
 Kenya
Kenya
-
 Korea
Korea
-
 Kuwait
-
 Kyrgyzstan
-
 Laos
Laos
-
 Latvia
-
 Lebanon
-
 Lesotho
-
 Libya
Libya
-
 Lithuania
-
 Luxembourg
-
 Madagascar
-
 Malaysia
-
 Malta
Malta
-
 Mauritius
-
 Mexico
-
 Moldova
-
 Mongolia
-
 Montenegro
-
 Morocco
-
 Mozambique
-
 Myanmar
-
 Namibia
-
 Nepal
Nepal
-
 Netherlands
-
 New Zealand
-
 Nigeria
-
 North Macedonia
-
 Norway
-
 Oman
Oman
-
 Pakistan
-
 Palestine
-
 Panama
-
 Papua New Guinea
-
 Paraguay
-
 Peru
Peru
-
 Philippines
-
 Poland
-
 Portugal
-
 Puerto Rico
-
 Qatar
Qatar
-
 Reunion
-
 Romania
-
 Rwanda
-
 Saudi Arabia
-
 Serbia
-
 Singapore
-
 Slovakia
-
 Slovenia
-
 Somalia
-
 South Africa
-
 Spain
Spain
-
 Sri Lanka
-
 Sweden
-
 Switzerland
-
 Syria
Syria
-
 Taiwan
-
 Tajikistan
-
 Tanzania
-
 Thailand
-
 Trinidad and Tobago
-
 Tunisia
-
 Turkey
-
 UAE
UAE
-
 Uganda
-
 Ukraine
-
 United Kingdom
-
United States
-
 Uruguay
-
 Uzbekistan
-
 Venezuela
-
 Vietnam
-
 Yemen
Yemen
-
 Zambia
-
 Zimbabwe
- Forex
- Crypto












