

Texas Instruments stock faces support test: Technical outlook

Texas Instruments (TXN) stock is trading at $270.93, down 4.18% on the day. The price stands below its key moving averages, reflecting soft short-term momentum within long-term support.
 297.80
316.78
Highlights
- Texas Instruments distributed a quarterly dividend of $1.42 per share on August 11, 2026, providing a 2% annualized yield.
- The dividend supports income-focused investors and signals management's ongoing commitment to returning capital to shareholders.
- Shares of Texas Instruments closed down 4.18%, trading below key short- and medium-term moving averages with technicals indicating further downside is more probable within a $261.71 to $278.46 range.
Dividend yields bolster sentiment despite dominance of selling flows
Texas Instruments paid a quarterly dividend of $1.42 per share, with the distribution made on August 11, 2026 to shareholders of record as of July 31, 2026, according to Defenseworld. This capital return, which represents an annualized yield of 2.0%, provides a steady income stream for investors and can help support longer-term holding sentiment. While such payments demonstrate management's commitment to shareholder returns, the impact on intraday price dynamics remains muted when immediate trading is dominated by selling flows.
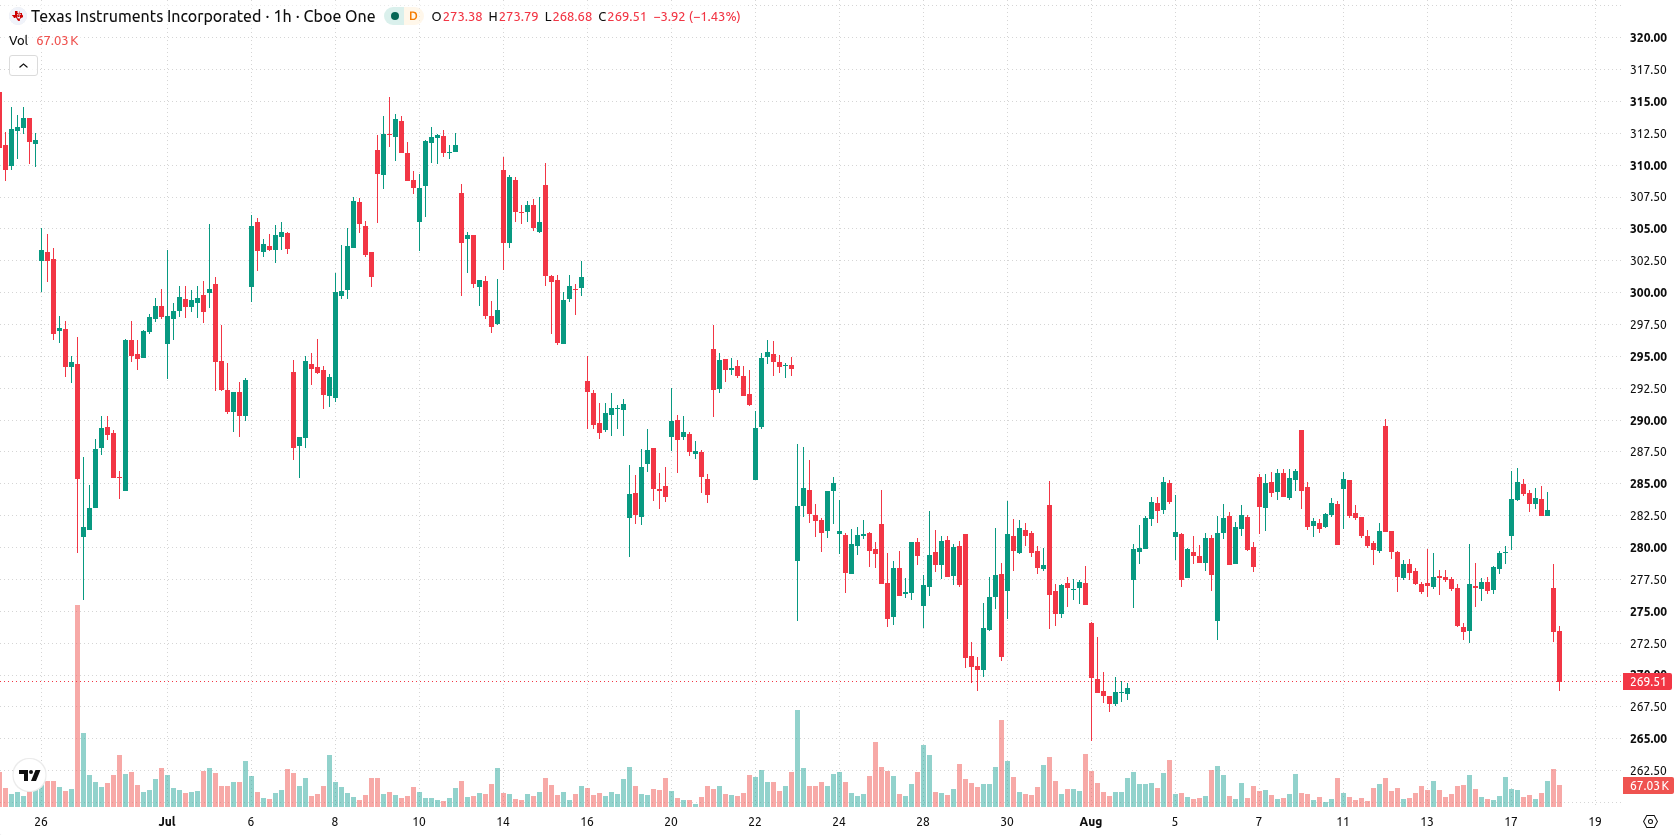
Seller momentum intensifies as resistance holds and indicators turn oversold
On the technical front, TXN/USD failed to recover above the MA-20 ($278.86) and MA-50 ($280.36) on the working timeframe, yet remains supported by the MA-200 at $232.33 on the daily chart. The Ichimoku Kijun at $278.64 now acts as the nearest resistance. Momentum indicators show MACD and ADX holding in neutral positions. RSI is deep in sell territory at 31.88, with both CCI and Stoch RSI indicating oversold conditions. Bull/Bear Power flags strong selling momentum intraday, while the Awesome Oscillator is neutral — all suggesting a standoff between pronounced short-term seller dominance and signs of potential downside exhaustion from oscillators.
Bearish bias persists as volatility bands cap short-term direction
In the short term, TXN is expected to consolidate within a range of $261.71 to $278.46, with a 26% probability of an upward move and 74% odds for further downside. The primary scenario favors continued trading inside this volatility band relative to current levels. A bullish break would require a close above immediate resistance at the Ichimoku Kijun, while a bearish extension could materialize if price fails to hold projected support near the lower boundary of the range.
Earlier, analysts noted that semiconductor shares were outperforming broader U.S. equities on supportive company-specific developments and policy signals. Current technicals for Texas Instruments suggest that traders should monitor the $261.71 to $278.46 consolidation range closely, as a decisive break outside this band may indicate the next directional move.






Latest Texas Instruments News




-
 Afghanistan
-
 Albania
-
 Algeria
-
 Angola
-
 Argentina
-
 Armenia
-
 Australia
-
 Austria
-
 Azerbaijan
-
 Bahamas
-
 Bahrain
-
 Bangladesh
-
 Belarus
-
 Belgium
-
 Bolivia
-
 Botswana
-
 Brazil
-
 Brunei
-
 Bulgaria
-
 Cambodia
-
 Cameroon
-
 Canada
-
 Chile
-
 China
-
 Colombia
-
 Congo
-
 Costa Rica
-
 Cote d'Ivoire
-
 Croatia
-
 Cuba
-
 Cyprus
-
 Czechia
-
 DR Congo
-
 Denmark
-
 Dominican Republic
-
 Ecuador
-
 Egypt
-
 El Salvador
-
 Estonia
-
 Eswatini
-
 Ethiopia
-
 Finland
-
 France
-
 Georgia
-
 Germany
-
 Ghana
-
 Greece
-
 Haiti
-
 Hong Kong
-
 Hungary
-
 India
-
 Indonesia
-
 Iran, Islamic republic
-
 Iraq
-
 Ireland
-
 Israel
-
 Italy
-
 Jamaica
-
 Japan
-
 Jordan
-
 Kazakhstan
-
 Kenya
-
 Korea
-
 Kuwait
-
 Kyrgyzstan
-
 Laos
-
 Latvia
-
 Lebanon
-
 Lesotho
-
 Libya
-
 Lithuania
-
 Luxembourg
-
 Madagascar
-
 Malaysia
-
 Malta
-
 Mauritius
-
 Mexico
-
 Moldova
-
 Mongolia
-
 Montenegro
-
 Morocco
-
 Mozambique
-
 Myanmar
-
 Namibia
-
 Nepal
-
 Netherlands
-
 New Zealand
-
 Nigeria
-
 North Macedonia
-
 Norway
-
 Oman
-
 Pakistan
-
 Palestine
-
 Panama
-
 Papua New Guinea
-
 Paraguay
-
 Peru
-
 Philippines
-
 Poland
-
 Portugal
-
 Puerto Rico
-
 Qatar
-
 Reunion
-
 Romania
-
 Rwanda
-
 Saudi Arabia
-
 Serbia
-
 Singapore
-
 Slovakia
-
 Slovenia
-
 Somalia
-
 South Africa
-
 Spain
-
 Sri Lanka
-
 Sweden
-
 Switzerland
-
 Syria
-
 Taiwan
-
 Tajikistan
-
 Tanzania
-
 Thailand
-
 Trinidad and Tobago
-
 Tunisia
-
 Turkey
-
 UAE
-
 Uganda
-
 Ukraine
-
 United Kingdom
-
United States
-
 Uruguay
-
 Uzbekistan
-
 Venezuela
-
 Vietnam
-
 Yemen
-
 Zambia
-
 Zimbabwe
- Forex
- Crypto












