


Technical signals drove TE Connectivity Ltd (TEL) down 4.05% as selling pressure dominated following an early downside gap and failed price recovery attempts. The move is reinforced by the stock's position below both its 20-day and 200-day moving averages, with only marginal medium-term support remaining in place.
 224.26
230.00
Highlights
- TE Connectivity stock trades below short- and long-term moving averages, indicating persistent downward pressure with only marginal medium-term support.
- Technical indicators are mixed, with some signals showing buyer momentum but others remaining neutral and Bull/Bear Power flashing an overbought risk.
- Shares are forecast to consolidate between $199.62 and $213.15 over the next five days, with over 80% probability of moving higher.
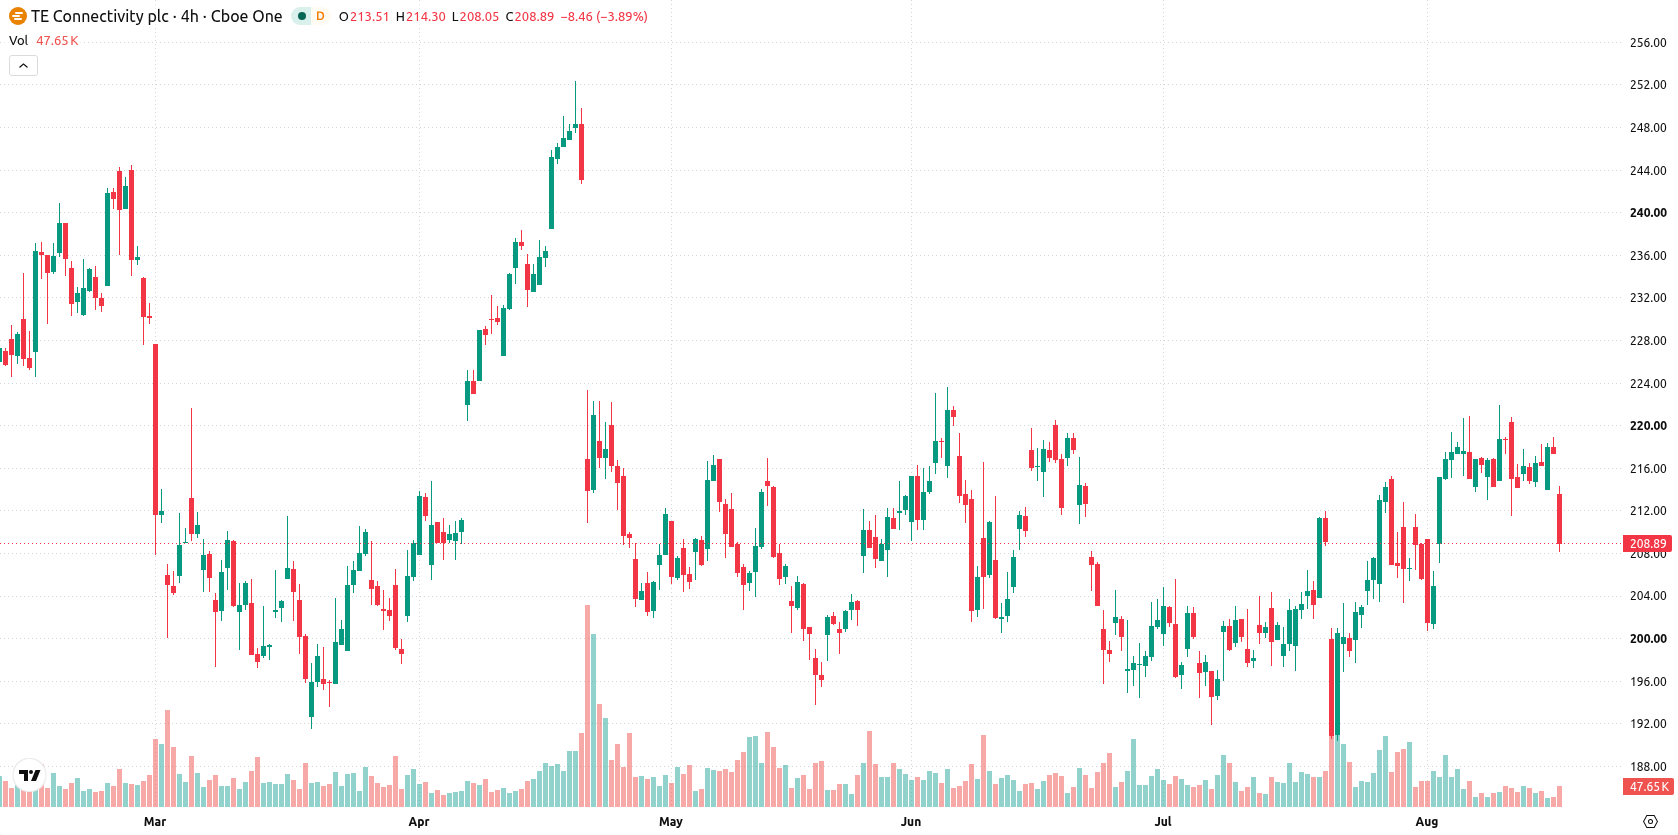
Mixed momentum signals as technical support barely holds
TE Connectivity is trading below both its 20-day ($210.94) and 200-day ($218.94) moving averages, but remains above the 50-day ($206.9) level. This positioning suggests short- and long-term downward pressure persists, with only marginal medium-term support; the Ichimoku Kijun at $206.13 lends modest additional support just below. Momentum signals are mixed; the MACD and Relative Strength Index (RSI) both indicate buyer momentum, while the Average Directional Index (ADX) and Stochastic RSI are neutral. Commodity Channel Index (CCI) and Hull Moving Average (HMA) suggest further buying interest, yet Bull/Bear Power (BBP) reveals clear intraday buyer dominance and flashes an overbought forecast. The Awesome Oscillator is neutral. The stock is down $8.81 or 4.05% after a downside gap of approximately $3.53 (1.62%), trading near its session low with intraday volatility at 2.73%. The intraday tone is soft with clear pressure after the open, diverging from underlying bullish momentum signals.
Previously it was reported that TE Connectivity was exhibiting strong, broad-based bullish momentum, with buyers dominating despite some mixed technical signals. The current pullback underscores a shift as downward pressure re-emerges, highlighting the importance of monitoring the $208.17 floor for a potential downside risk in the coming sessions.






Latest TE Connectivity Ltd News




-
 Afghanistan
-
 Albania
-
 Algeria
-
 Angola
-
 Argentina
-
 Armenia
-
 Australia
-
 Austria
-
 Azerbaijan
-
 Bahamas
-
 Bahrain
-
 Bangladesh
-
 Belarus
-
 Belgium
-
 Bolivia
-
 Botswana
-
 Brazil
-
 Brunei
-
 Bulgaria
-
 Cambodia
-
 Cameroon
-
 Canada
-
 Chile
-
 China
-
 Colombia
-
 Congo
-
 Costa Rica
-
 Cote d'Ivoire
-
 Croatia
-
 Cuba
-
 Cyprus
-
 Czechia
-
 DR Congo
-
 Denmark
-
 Dominican Republic
-
 Ecuador
-
 Egypt
-
 El Salvador
-
 Estonia
-
 Eswatini
-
 Ethiopia
-
 Finland
-
 France
-
 Georgia
-
 Germany
-
 Ghana
-
 Greece
-
 Haiti
-
 Hong Kong
-
 Hungary
-
 India
-
 Indonesia
-
 Iran, Islamic republic
-
 Iraq
-
 Ireland
-
 Israel
-
 Italy
-
 Jamaica
-
 Japan
-
 Jordan
-
 Kazakhstan
-
 Kenya
-
 Korea
-
 Kuwait
-
 Kyrgyzstan
-
 Laos
-
 Latvia
-
 Lebanon
-
 Lesotho
-
 Libya
-
 Lithuania
-
 Luxembourg
-
 Madagascar
-
 Malaysia
-
 Malta
-
 Mauritius
-
 Mexico
-
 Moldova
-
 Mongolia
-
 Montenegro
-
 Morocco
-
 Mozambique
-
 Myanmar
-
 Namibia
-
 Nepal
-
 Netherlands
-
 New Zealand
-
 Nigeria
-
 North Macedonia
-
 Norway
-
 Oman
-
 Pakistan
-
 Palestine
-
 Panama
-
 Papua New Guinea
-
 Paraguay
-
 Peru
-
 Philippines
-
 Poland
-
 Portugal
-
 Puerto Rico
-
 Qatar
-
 Reunion
-
 Romania
-
 Rwanda
-
 Saudi Arabia
-
 Serbia
-
 Singapore
-
 Slovakia
-
 Slovenia
-
 Somalia
-
 South Africa
-
 Spain
-
 Sri Lanka
-
 Sweden
-
 Switzerland
-
 Syria
-
 Taiwan
-
 Tajikistan
-
 Tanzania
-
 Thailand
-
 Trinidad and Tobago
-
 Tunisia
-
 Turkey
-
 UAE
-
 Uganda
-
 Ukraine
-
 United Kingdom
-
United States
-
 Uruguay
-
 Uzbekistan
-
 Venezuela
-
 Vietnam
-
 Yemen
-
 Zambia
-
 Zimbabwe
- Forex
- Crypto












