

Interactive Brokers stock faces support pressure: Downside targets to watch

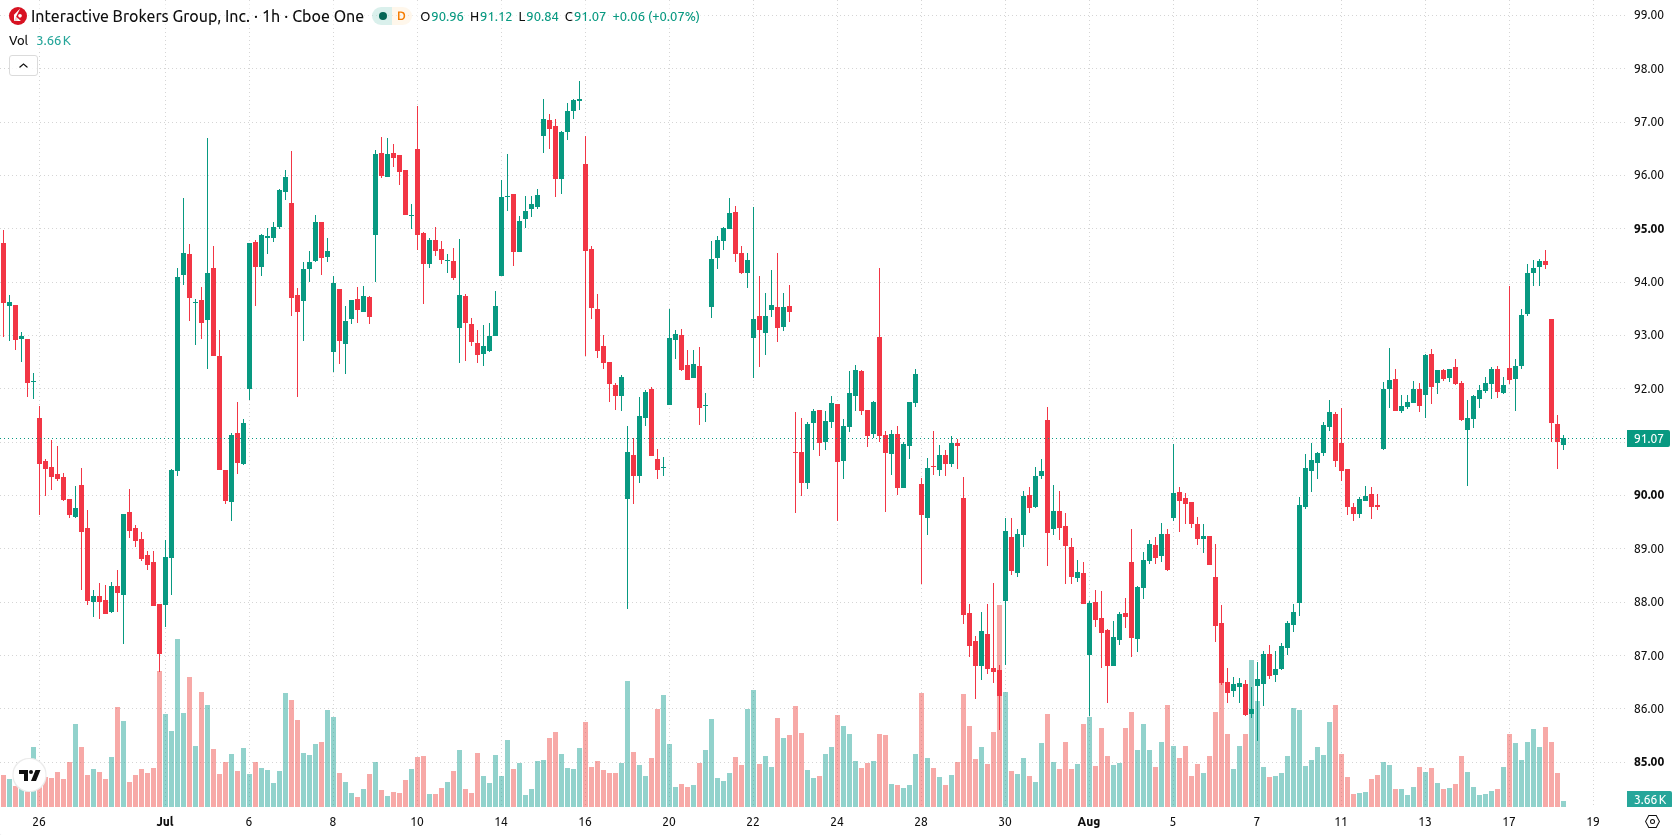
Interactive Brokers (IBKR) stock is trading at $91.01, marking a daily decline of 3.52%. The price currently sits below its key short- and medium-term moving averages but remains above long-term support levels.
 88.02
89.11
88.02
89.11
Highlights
- Interactive Brokers has partnered with SafetyPay to provide faster and lower-cost account funding for clients in Latin America.
- This development expands service capabilities in the region and may help grow Interactive Brokers customer numbers by easing funding access.
- Shares of Interactive Brokers fell 3.52% to $91.01, with technical signals mixed and a 57% probability of further downside within a $87.37 to $92.96 range.
Latin America expansion lifts capabilities amid continued selling pressure
Interactive Brokers has introduced a new funding solution for clients in Latin America through a collaboration with Paysafe's SafetyPay, enabling faster and more cost-efficient account funding in the region, according to Leaprate. This partnership broadens operational capabilities for regional clients and could foster growth in the Latin American customer base by reducing frictions in the account funding process. The development represents a positive expansion of services, though price action has remained under broader selling pressure.
Mixed technical signals as price tests resistance and momentum fades
On the technical front, IBKR is trading below both the MA-20 at $92.46 and the MA-50 at $91.24, while remaining above the MA-200 at $77.23. The Ichimoku Kijun level stands at $92.35, serving as immediate resistance. Momentum indicators show a strong buy signal from MACD, but ADX signals weakness. RSI registers at 41.01, a bearish signal, while Stochastic RSI and CCI readings indicate oversold conditions that may suggest temporary exhaustion of sellers. Bull/Bear Power points to intraday seller dominance, while the Awesome Oscillator remains neutral, not reinforcing the negative bias.
Directional bias favored lower as rangebound trading expected
For the coming days, the expected price range is $87.37 to $92.96, forming a volatility band relative to current levels. The most likely case is for IBKR to consolidate within this range. There is a 57% probability of further downside and a 43% chance of an upward move, according to current indicator inputs. A convincing break above the $92.35 resistance would be needed for a bullish scenario, while a decline below $87.37 would confirm a bearish extension.
Earlier, analysts noted that Interactive Brokers faced near-term selling pressure within a broader bullish trend, with technical factors contributing to recent volatility. The current analysis adds that while the company continues to expand its client offerings, traders should monitor the $92.35 resistance and $87.37 support as key levels likely to frame price action in the days ahead.





Latest Interactive Brokers News





-
 Afghanistan
-
 Albania
-
 Algeria
-
 Angola
-
 Argentina
-
 Armenia
-
 Australia
-
 Austria
-
 Azerbaijan
-
 Bahamas
-
 Bahrain
-
 Bangladesh
-
 Belarus
-
 Belgium
-
 Bolivia
-
 Botswana
-
 Brazil
-
 Brunei
-
 Bulgaria
-
 Cambodia
-
 Cameroon
-
 Canada
-
 Chile
Chile
-
 China
China
-
 Colombia
-
 Congo
Congo
-
 Costa Rica
-
 Cote d'Ivoire
-
 Croatia
-
 Cuba
Cuba
-
 Cyprus
-
 Czechia
-
 DR Congo
-
 Denmark
-
 Dominican Republic
-
 Ecuador
-
 Egypt
Egypt
-
 El Salvador
-
 Estonia
-
 Eswatini
-
 Ethiopia
-
 Finland
-
 France
-
 Georgia
-
 Germany
-
 Ghana
Ghana
-
 Greece
-
 Haiti
Haiti
-
 Hong Kong
-
 Hungary
-
 India
India
-
 Indonesia
-
 Iran, Islamic republic
-
 Iraq
Iraq
-
 Ireland
-
 Israel
-
 Italy
Italy
-
 Jamaica
-
 Japan
Japan
-
 Jordan
-
 Kazakhstan
-
 Kenya
Kenya
-
 Korea
Korea
-
 Kuwait
-
 Kyrgyzstan
-
 Laos
Laos
-
 Latvia
-
 Lebanon
-
 Lesotho
-
 Libya
Libya
-
 Lithuania
-
 Luxembourg
-
 Madagascar
-
 Malaysia
-
 Malta
Malta
-
 Mauritius
-
 Mexico
-
 Moldova
-
 Mongolia
-
 Montenegro
-
 Morocco
-
 Mozambique
-
 Myanmar
-
 Namibia
-
 Nepal
Nepal
-
 Netherlands
-
 New Zealand
-
 Nigeria
-
 North Macedonia
-
 Norway
-
 Oman
Oman
-
 Pakistan
-
 Palestine
-
 Panama
-
 Papua New Guinea
-
 Paraguay
-
 Peru
Peru
-
 Philippines
-
 Poland
-
 Portugal
-
 Puerto Rico
-
 Qatar
Qatar
-
 Reunion
-
 Romania
-
 Rwanda
-
 Saudi Arabia
-
 Serbia
-
 Singapore
-
 Slovakia
-
 Slovenia
-
 Somalia
-
 South Africa
-
 Spain
Spain
-
 Sri Lanka
-
 Sweden
-
 Switzerland
-
 Syria
Syria
-
 Taiwan
-
 Tajikistan
-
 Tanzania
-
 Thailand
-
 Trinidad and Tobago
-
 Tunisia
-
 Turkey
-
 UAE
UAE
-
 Uganda
-
 Ukraine
-
 United Kingdom
-
United States
-
 Uruguay
-
 Uzbekistan
-
 Venezuela
-
 Vietnam
-
 Yemen
Yemen
-
 Zambia
-
 Zimbabwe
- Forex
- Crypto












