

TYL climbs nearly 5% as buyers dominate intraday action

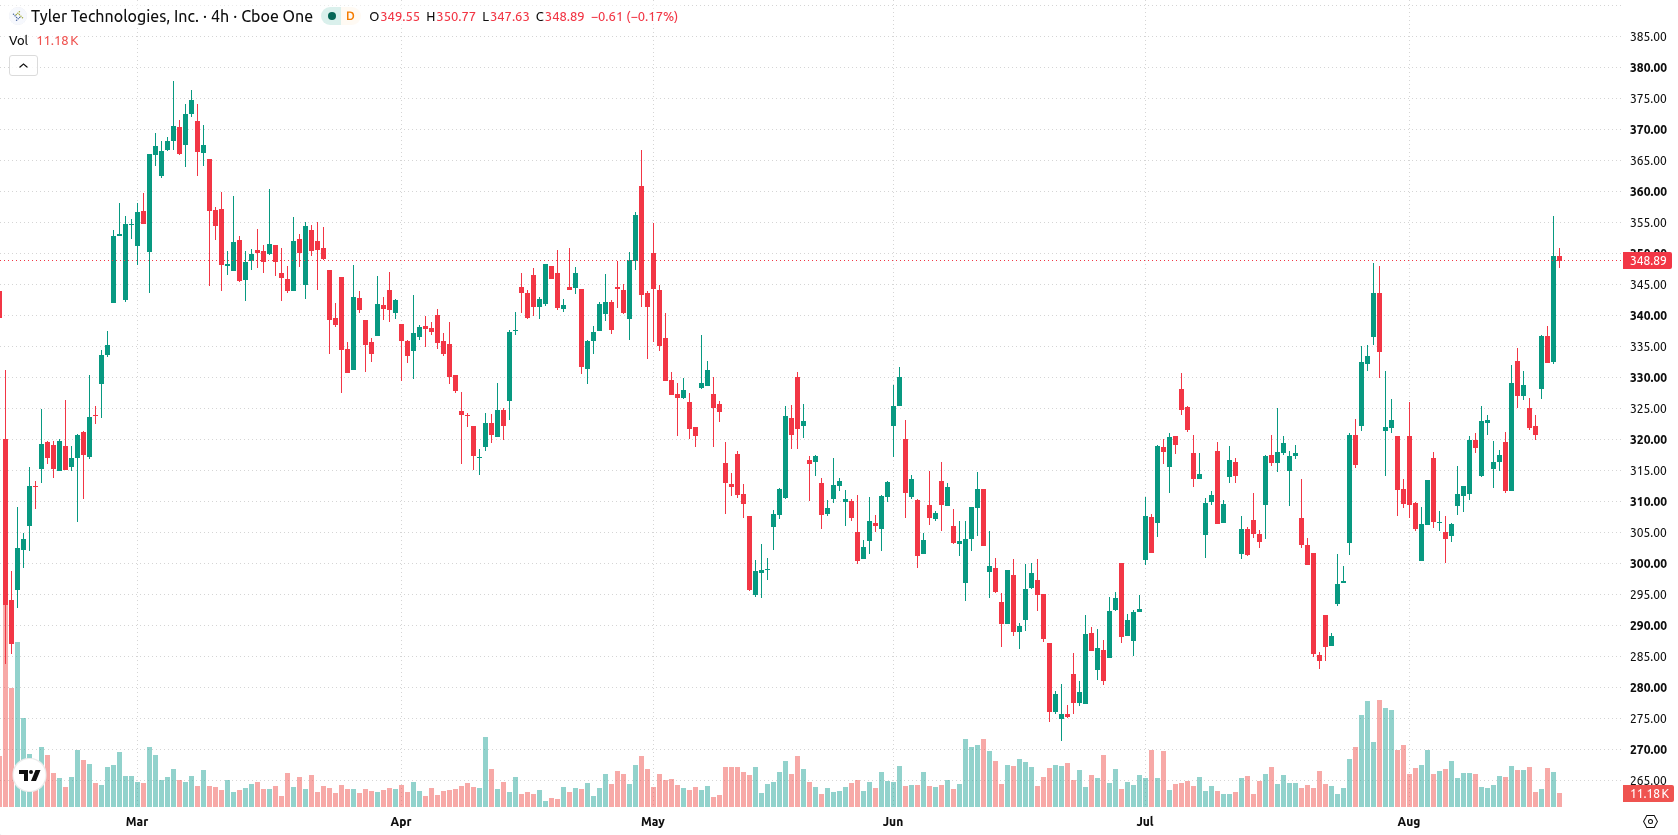
Strong technical momentum fueled a 4.89% surge in Tyler Technologies (TYL), with bullish pressure driving the session's advance. The up move is supported by the stock's position above its 20- and 50-day moving averages, even as longer-term momentum remains under pressure below the 200-day threshold.
 409.01
409.32
Highlights
- Shares of Tyler Technologies trade at $348.47, up 4.89% for the session with price near the session high.
- Technical indicators show a short- and medium-term bullish structure, but longer-term momentum remains under pressure and several signals indicate overbought conditions.
- The forecasted 5-day trading range is $334.89 to $367.45, with a 74% probability of an upward move and key resistance at $355.89.
Bullish setup as moving averages and indicators align
Tyler Technologies is trading above its 20-day and 50-day moving averages at $314.95 and $306.60, but remains below the 200-day average of $364.37. This setup signals a bullish short- and medium-term structure, while indicating ongoing pressure on the longer-term trend. Nearest resistance is identified at $355.89, with support at $338.22. Momentum indicators provide a bullish tilt: the MACD shows buying interest, ADX is neutral, RSI stands at 58.73 with a buy outlook, while the Stochastic RSI, CCI, and Bull/Bear Power highlight overbought conditions. The BBP at 17.87 confirms buyers dominate intraday action, and the Awesome Oscillator signals persistent upward momentum. Intraday trading reflects strong buying near session highs and increased volatility, reinforcing bullish indicators.
Earlier, analysts noted that Tyler Technologies exhibited short-term bullish momentum while longer-term resistance remained in place. The current technical setup reinforces this view, with a widening volatility band and key resistance at $355.89 emerging as the pivotal level for a potential breakout or reversal.






Latest Tyler Technologies News




-
 Afghanistan
-
 Albania
-
 Algeria
-
 Angola
-
 Argentina
-
 Armenia
-
 Australia
-
 Austria
-
 Azerbaijan
-
 Bahamas
-
 Bahrain
-
 Bangladesh
-
 Belarus
-
 Belgium
-
 Bolivia
-
 Botswana
-
 Brazil
-
 Brunei
-
 Bulgaria
-
 Cambodia
-
 Cameroon
-
 Canada
-
 Chile
-
 China
-
 Colombia
-
 Congo
-
 Costa Rica
-
 Cote d'Ivoire
-
 Croatia
-
 Cuba
-
 Cyprus
-
 Czechia
-
 DR Congo
-
 Denmark
-
 Dominican Republic
-
 Ecuador
-
 Egypt
-
 El Salvador
-
 Estonia
-
 Eswatini
-
 Ethiopia
-
 Finland
-
 France
-
 Georgia
-
 Germany
-
 Ghana
-
 Greece
-
 Haiti
-
 Hong Kong
-
 Hungary
-
 India
-
 Indonesia
-
 Iran, Islamic republic
-
 Iraq
-
 Ireland
-
 Israel
-
 Italy
-
 Jamaica
-
 Japan
-
 Jordan
-
 Kazakhstan
-
 Kenya
-
 Korea
-
 Kuwait
-
 Kyrgyzstan
-
 Laos
-
 Latvia
-
 Lebanon
-
 Lesotho
-
 Libya
-
 Lithuania
-
 Luxembourg
-
 Madagascar
-
 Malaysia
-
 Malta
-
 Mauritius
-
 Mexico
-
 Moldova
-
 Mongolia
-
 Montenegro
-
 Morocco
-
 Mozambique
-
 Myanmar
-
 Namibia
-
 Nepal
-
 Netherlands
-
 New Zealand
-
 Nigeria
-
 North Macedonia
-
 Norway
-
 Oman
-
 Pakistan
-
 Palestine
-
 Panama
-
 Papua New Guinea
-
 Paraguay
-
 Peru
-
 Philippines
-
 Poland
-
 Portugal
-
 Puerto Rico
-
 Qatar
-
 Reunion
-
 Romania
-
 Rwanda
-
 Saudi Arabia
-
 Serbia
-
 Singapore
-
 Slovakia
-
 Slovenia
-
 Somalia
-
 South Africa
-
 Spain
-
 Sri Lanka
-
 Sweden
-
 Switzerland
-
 Syria
-
 Taiwan
-
 Tajikistan
-
 Tanzania
-
 Thailand
-
 Trinidad and Tobago
-
 Tunisia
-
 Turkey
-
 UAE
-
 Uganda
-
 Ukraine
-
 United Kingdom
-
United States
-
 Uruguay
-
 Uzbekistan
-
 Venezuela
-
 Vietnam
-
 Yemen
-
 Zambia
-
 Zimbabwe
- Forex
- Crypto












