

Morgan Stanley stock volatility stays elevated amid consolidation near key technical levels: weekly analysis

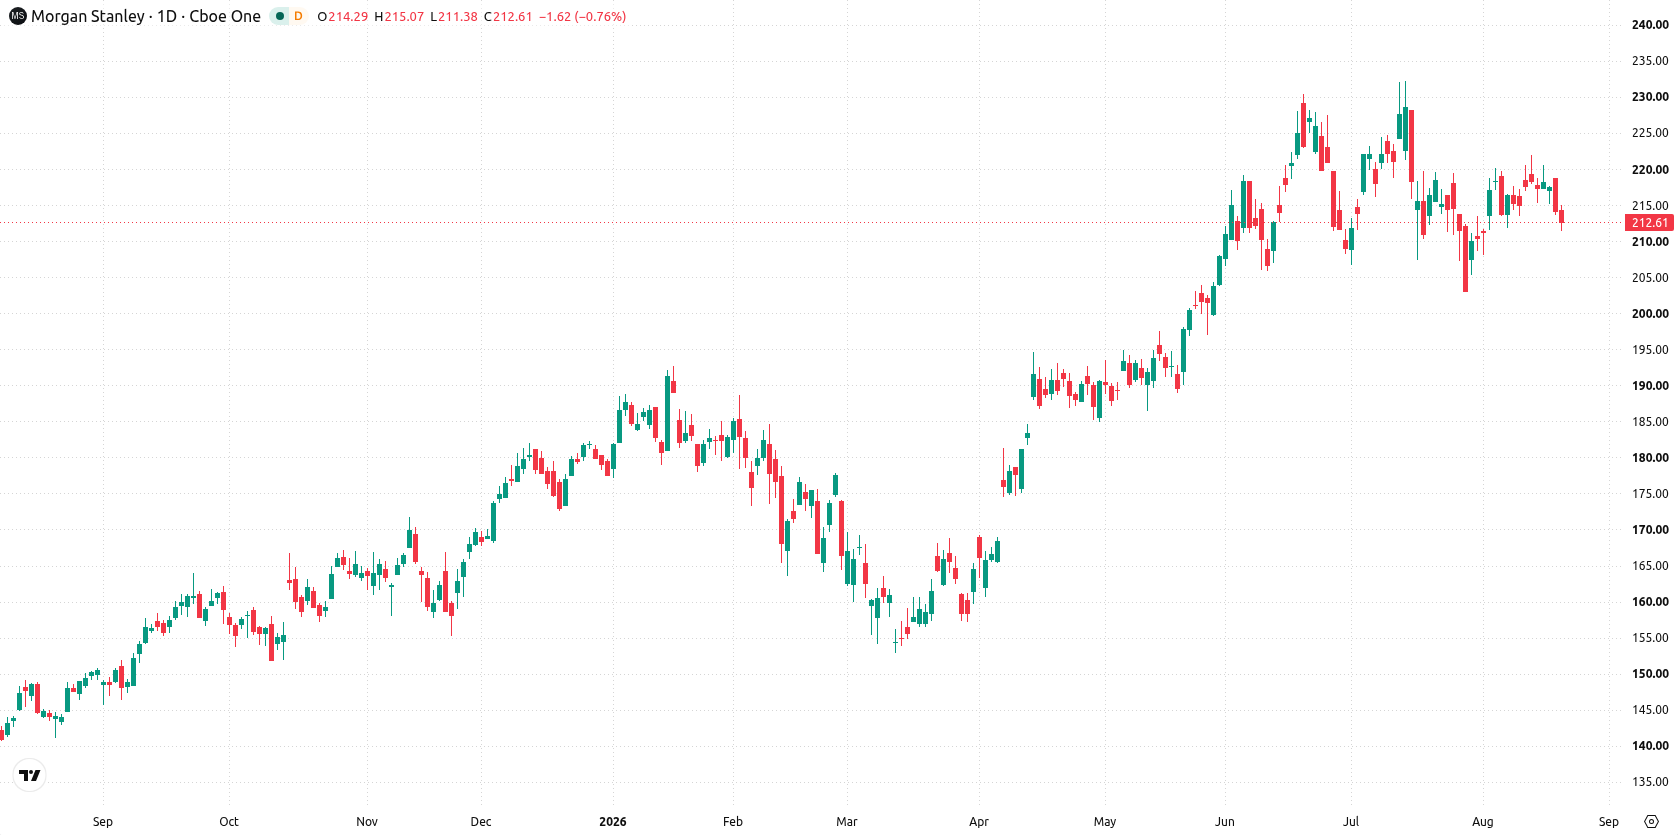
Shares of Morgan Stanley (MS) are trading near $213 after a sustained decline of more than 2% over the past week, putting the stock deeper into oversold territory. Technical signals remain mixed, with short-term weakness visible but some momentum gauges hinting at possible buying interest ahead. Traders will be watching to see if this compressed setup resolves into renewed movement in the coming days.
 186.08
192.90
Highlights
- Shares of Morgan Stanley fell 2.15% over the past seven days and are currently trading below key short-term moving averages.
- The stock faces immediate resistance at $213.6, with support far below at $187.95 and overhead resistance at $217.6.
- The coming week is likely to see consolidation between $200.78 and $213.6, with a 61% probability of a move lower.
Dividend actions and debt offerings shape flows this week
Morgan Stanley declared regular dividends on its preferred stock series, with payments set for September 15 and October 15, 2026, according to MarketScreener and Stock Titan. The company also finalized several fixed-income offerings totaling about $7.54 million in senior unsecured global medium-term notes, as reported by Yahoo Finance. In addition, Morgan Stanley B.V. announced early redemptions for two securities, one valued at $5.13 million and settling on August 24, 2026, per Investegate.
Price compression builds as technical signals diverge over the week
On the daily chart, the current structure shows the stock under short-term pressure, with the price sitting below key moving averages and pinned beneath immediate resistance at $213.6. Volatility over the past week stands at 3.24%, with momentum indicators sending mixed signals: the MACD is in positive territory at 0.62 and forecasts a buy, while the Stochastic RSI is approaching oversold, warning of possible renewed interest from buyers. The nearest support is well below at $187.95, while the Ichimoku Kijun at $217.6 adds another layer of resistance overhead. Momentum character points to a contained move within a narrow range, suggesting compression as the dominant theme for now.
Consolidation likely as breakout risks define next week’s outlook
Over the coming trading week, the expected range is $200.78 to $216.06. There is a 39% probability of an increase and a 61% probability of a decrease. The base case is continued consolidation between $200.78 and resistance at $213.6. Should the stock break above $213.6, buyers may target the resistance at $217.6. If selling drives the stock below $200.78, the next meaningful support sits at $187.95.
Earlier, analysts noted that Morgan Stanley’s technical outlook had been shaped by consolidation near resistance amid ongoing product launches and governance developments. The current article signals a shift as the stock dips further below key levels, making the $213.6 resistance and support at $200.78 critical markers for traders assessing the next move.










-
 Afghanistan
-
 Albania
-
 Algeria
-
 Angola
-
 Argentina
-
 Armenia
-
 Australia
-
 Austria
-
 Azerbaijan
-
 Bahamas
-
 Bahrain
-
 Bangladesh
-
 Belarus
-
 Belgium
-
 Bolivia
-
 Botswana
-
 Brazil
-
 Brunei
-
 Bulgaria
-
 Cambodia
-
 Cameroon
-
 Canada
-
 Chile
-
 China
-
 Colombia
-
 Congo
-
 Costa Rica
-
 Cote d'Ivoire
-
 Croatia
-
 Cuba
-
 Cyprus
-
 Czechia
-
 DR Congo
-
 Denmark
-
 Dominican Republic
-
 Ecuador
-
 Egypt
-
 El Salvador
-
 Estonia
-
 Eswatini
-
 Ethiopia
-
 Finland
-
 France
-
 Georgia
-
 Germany
-
 Ghana
-
 Greece
-
 Haiti
-
 Hong Kong
-
 Hungary
-
 India
-
 Indonesia
-
 Iran, Islamic republic
-
 Iraq
-
 Ireland
-
 Israel
-
 Italy
-
 Jamaica
-
 Japan
-
 Jordan
-
 Kazakhstan
-
 Kenya
-
 Korea
-
 Kuwait
-
 Kyrgyzstan
-
 Laos
-
 Latvia
-
 Lebanon
-
 Lesotho
-
 Libya
-
 Lithuania
-
 Luxembourg
-
 Madagascar
-
 Malaysia
-
 Malta
-
 Mauritius
-
 Mexico
-
 Moldova
-
 Mongolia
-
 Montenegro
-
 Morocco
-
 Mozambique
-
 Myanmar
-
 Namibia
-
 Nepal
-
 Netherlands
-
 New Zealand
-
 Nigeria
-
 North Macedonia
-
 Norway
-
 Oman
-
 Pakistan
-
 Palestine
-
 Panama
-
 Papua New Guinea
-
 Paraguay
-
 Peru
-
 Philippines
-
 Poland
-
 Portugal
-
 Puerto Rico
-
 Qatar
-
 Reunion
-
 Romania
-
 Rwanda
-
 Saudi Arabia
-
 Serbia
-
 Singapore
-
 Slovakia
-
 Slovenia
-
 Somalia
-
 South Africa
-
 Spain
-
 Sri Lanka
-
 Sweden
-
 Switzerland
-
 Syria
-
 Taiwan
-
 Tajikistan
-
 Tanzania
-
 Thailand
-
 Trinidad and Tobago
-
 Tunisia
-
 Turkey
-
 UAE
-
 Uganda
-
 Ukraine
-
 United Kingdom
-
United States
-
 Uruguay
-
 Uzbekistan
-
 Venezuela
-
 Vietnam
-
 Yemen
-
 Zambia
-
 Zimbabwe
- Forex
- Crypto












