

Morgan Stanley shares technical analysis: Support test at $204.64 limits further decline

Morgan Stanley (MS) stock is trading at $207.74, down 3.03% for the day and opening with a gap lower amid heightened volatility. The price remains below its key moving averages on short and medium timeframes, while still holding above longer-term averages.
 186.99
192.90
Highlights
- Morgan Stanley stock has increased its dividend four times in five years, achieving 22.85% average annual growth.
- Bank of Montreal registered medium-term notes partially linked to Morgan Stanley stock, signaling potential demand from structured products.
- Morgan Stanley stock trades below short- and medium-term averages with bearish momentum, and the expected price range for the next 2 to 3 days is $204.64 to $210.84.
Shareholder returns rise as capital returns fail to offset selling
Morgan Stanley has steadily increased its dividend four times on a year-over-year basis in the past five years, achieving an average annual growth of 22.85%, according to Finance Yahoo. This ongoing pattern demonstrates a track record of returning capital to shareholders and reflects sustained underlying profitability, but has not prevented current downward pressure on the stock. In addition, Streetinsider reported that Bank of Montreal filed a registration statement for medium-term notes due August 31, 2029, which are partially linked to Morgan Stanley's common stock and could introduce additional structured product demand.
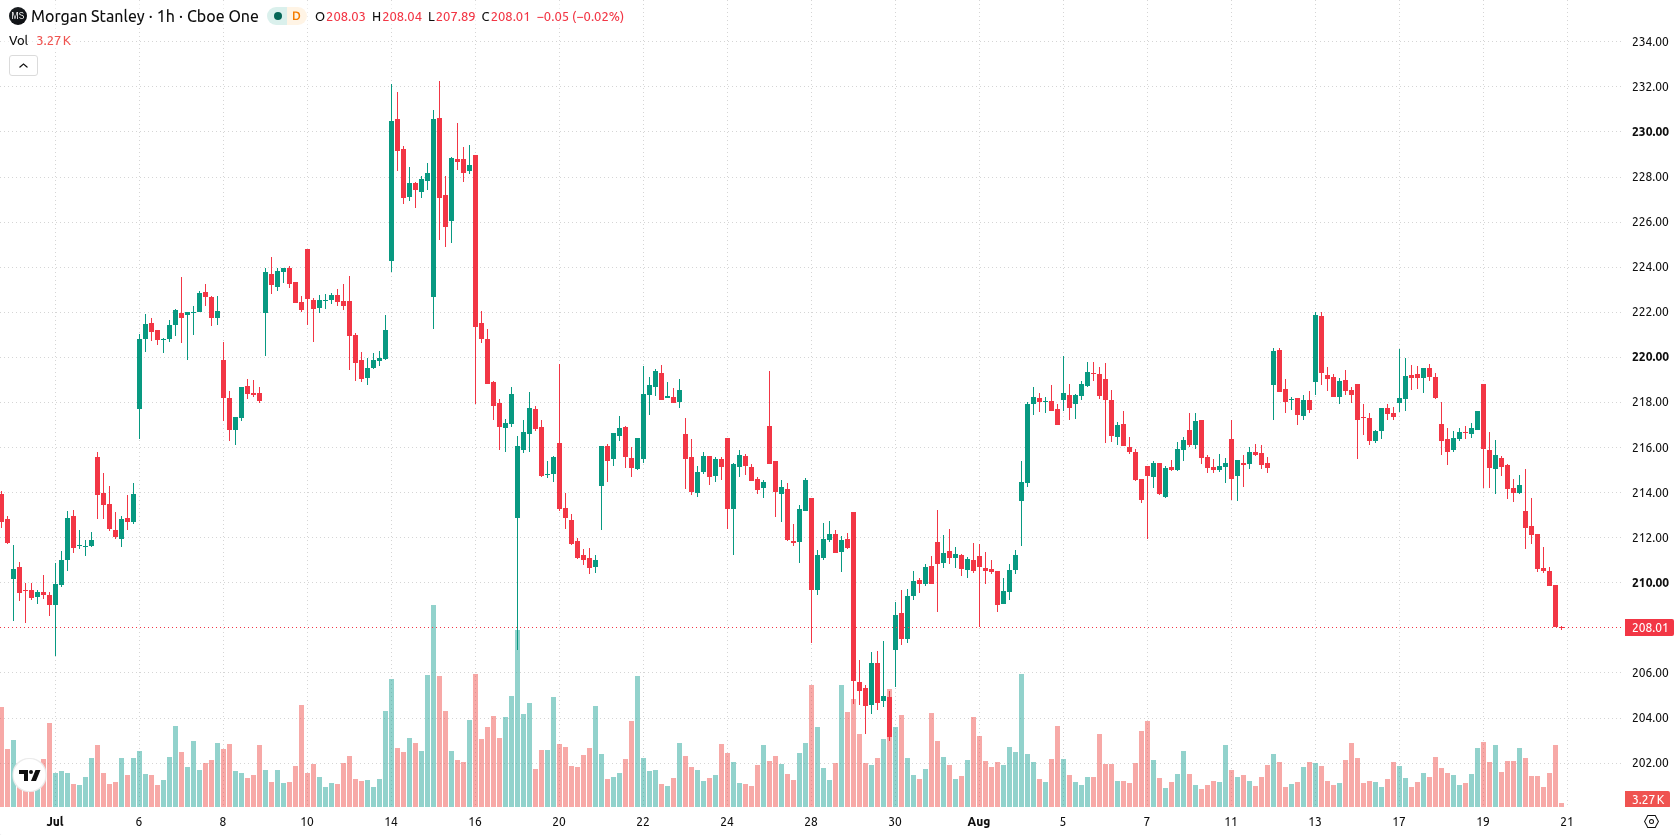
Downtrend persists as negative momentum and support levels converge
On the technical side, MS is trading below both the MA-20 and MA-50 on the hourly chart, with the nearest support level seen at $204.64 and immediate resistance at the Ichimoku Kijun set at $214.47. The long-term MA-200 is currently providing a buffer below the market. Momentum indicators are heavily negative: both MACD and ADX confirm active Sell signals, while Bull/Bear Power reflects dominant intraday seller pressure and the Awesome Oscillator also confirms the downtrend. RSI, Stoch RSI, and CCI are all in oversold territory, suggesting that downside is stretched, but no reversal signals have been confirmed.
Bearish continuation likely as consolidation limits recovery prospects
Looking ahead to the next two to three trading days, price action is expected to consolidate within a volatility band between $204.64 and $210.84. There is a much higher probability (78%) of a continued downward move, while the likelihood of an upward move remains low (22%). Should MS break above immediate resistance at $214.47, a recovery scenario could play out; conversely, a drop below $204.64 would likely extend recent losses.
Earlier, analysts noted that Morgan Stanley's stock was in a consolidation phase with risks skewed toward further downside if key support levels were breached. The latest technical signals and heightened volatility now reinforce the bearish scenario, making a decisive move below $204.64 a critical risk for further declines in the near term.










-
 Afghanistan
-
 Albania
-
 Algeria
-
 Angola
-
 Argentina
-
 Armenia
-
 Australia
-
 Austria
-
 Azerbaijan
-
 Bahamas
-
 Bahrain
-
 Bangladesh
-
 Belarus
-
 Belgium
-
 Bolivia
-
 Botswana
-
 Brazil
-
 Brunei
-
 Bulgaria
-
 Cambodia
-
 Cameroon
-
 Canada
-
 Chile
-
 China
-
 Colombia
-
 Congo
-
 Costa Rica
-
 Cote d'Ivoire
-
 Croatia
-
 Cuba
-
 Cyprus
-
 Czechia
-
 DR Congo
-
 Denmark
-
 Dominican Republic
-
 Ecuador
-
 Egypt
-
 El Salvador
-
 Estonia
-
 Eswatini
-
 Ethiopia
-
 Finland
-
 France
-
 Georgia
-
 Germany
-
 Ghana
-
 Greece
-
 Haiti
-
 Hong Kong
-
 Hungary
-
 India
-
 Indonesia
-
 Iran, Islamic republic
-
 Iraq
-
 Ireland
-
 Israel
-
 Italy
-
 Jamaica
-
 Japan
-
 Jordan
-
 Kazakhstan
-
 Kenya
-
 Korea
-
 Kuwait
-
 Kyrgyzstan
-
 Laos
-
 Latvia
-
 Lebanon
-
 Lesotho
-
 Libya
-
 Lithuania
-
 Luxembourg
-
 Madagascar
-
 Malaysia
-
 Malta
-
 Mauritius
-
 Mexico
-
 Moldova
-
 Mongolia
-
 Montenegro
-
 Morocco
-
 Mozambique
-
 Myanmar
-
 Namibia
-
 Nepal
-
 Netherlands
-
 New Zealand
-
 Nigeria
-
 North Macedonia
-
 Norway
-
 Oman
-
 Pakistan
-
 Palestine
-
 Panama
-
 Papua New Guinea
-
 Paraguay
-
 Peru
-
 Philippines
-
 Poland
-
 Portugal
-
 Puerto Rico
-
 Qatar
-
 Reunion
-
 Romania
-
 Rwanda
-
 Saudi Arabia
-
 Serbia
-
 Singapore
-
 Slovakia
-
 Slovenia
-
 Somalia
-
 South Africa
-
 Spain
-
 Sri Lanka
-
 Sweden
-
 Switzerland
-
 Syria
-
 Taiwan
-
 Tajikistan
-
 Tanzania
-
 Thailand
-
 Trinidad and Tobago
-
 Tunisia
-
 Turkey
-
 UAE
-
 Uganda
-
 Ukraine
-
 United Kingdom
-
United States
-
 Uruguay
-
 Uzbekistan
-
 Venezuela
-
 Vietnam
-
 Yemen
-
 Zambia
-
 Zimbabwe
- Forex
- Crypto












