

Synchrony Financial stock rises over 3% as buyers respond to institutional portfolio adjustments and political investor activity

Synchrony Financial (SYF) advanced 3.12% as buyers responded to institutional portfolio adjustments and increased activity among political investors. The move is supported by bullish alignment across short-, medium-, and long-term moving averages, confirming sustained demand over multiple timeframes.
 77.03
77.72
Highlights
- Investor activity in Synchrony Financial stock was mixed last quarter, with 523 institutions increasing holdings and 508 reducing positions.
- Recent trades in shares of Synchrony Financial by members of Congress have been recorded over the past six months.
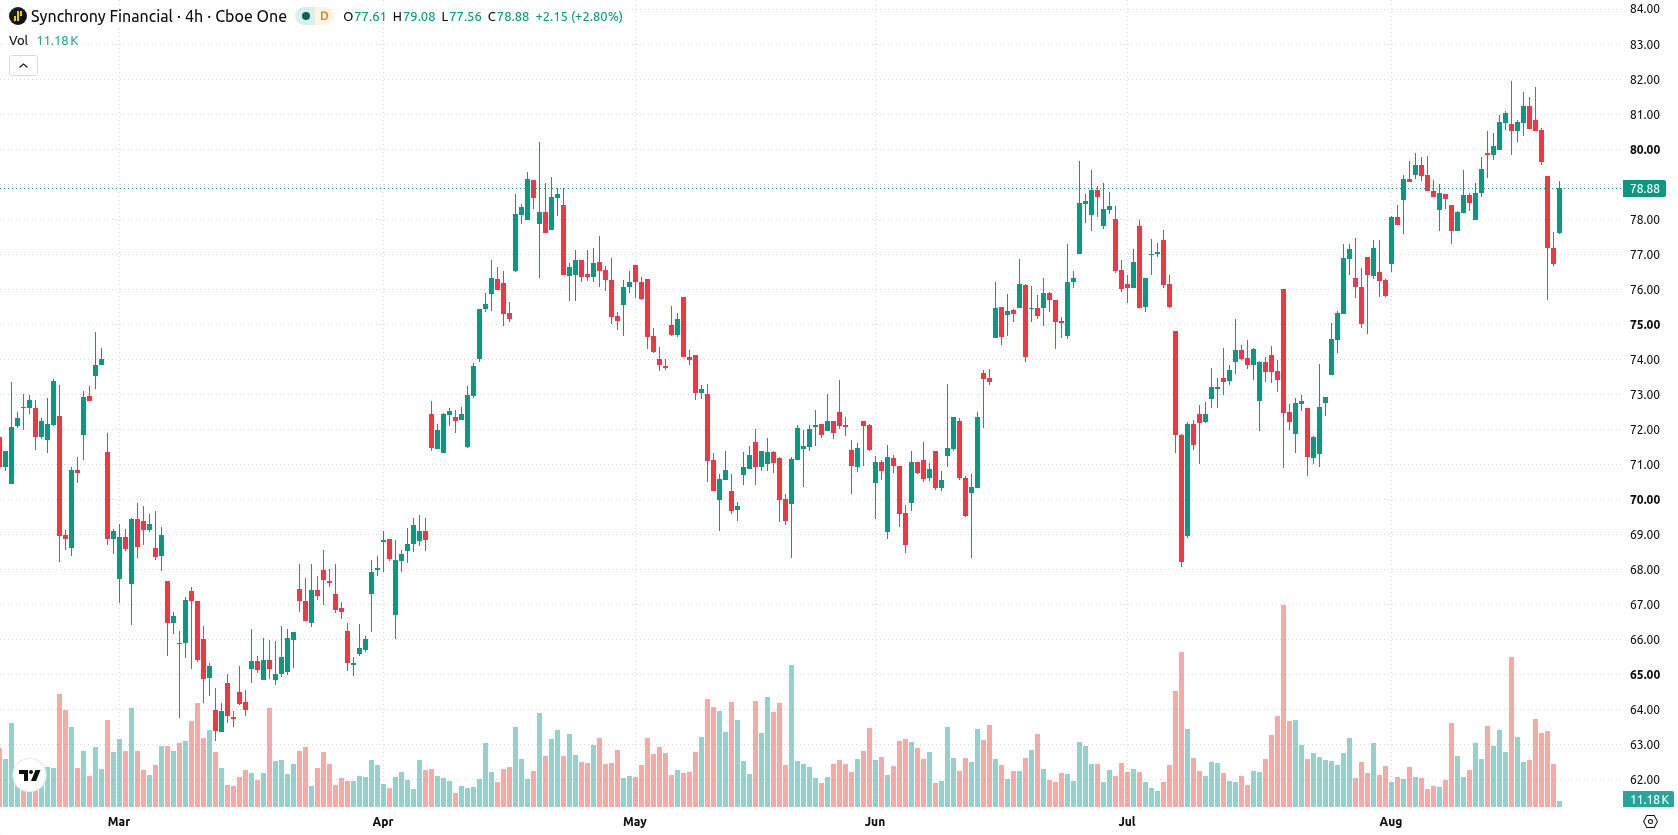
- Shares are trading in a bullish trend near $79.1, with a five-day forecast range of $76 to $82.19 and diverging momentum signals warning of potential consolidation or correction.
Portfolio rebalancing intensifies amid credit risk concerns and political trades
Investor concerns about consumer credit performance and broader consumer finance risk have influenced Synchrony Financial. During the most recent quarter, institutional investors made significant adjustments to their SYF holdings, with 523 increasing and 508 decreasing their positions. Trades in SYF shares by members of Congress have also been recorded over the past six months.
Bullish momentum persists despite mixed signals and technical resistance
Synchrony Financial is trading above its 20-day, 50-day, and 200-day moving averages at $78.07, $75.83, and $74.81 respectively, which confirms bullish trends across multiple timeframes. The price sits above the Ichimoku Kijun at $76.29, indicating sustained upside momentum. Immediate resistance is seen at $81.92 while support lies at $78.54. Momentum readings are mixed: the MACD signals strong buy momentum, the Average Directional Index (ADX) is neutral, the Relative Strength Index (RSI) is at 47.13 with a "Sell" forecast, and the Stochastic RSI is at zero, flagging oversold conditions. The Commodity Channel Index (CCI) is neutral and Bull/Bear Power (BBP) slightly favors buyers, though it suggests oversold conditions. Price action shows a daily gain to $79.10, up $2.39 or 3.12% after an upside gap of 1.17%. The stock is trading near the session high with intraday volatility at 1.20%. Buyers dominate intraday flows, but several signals warn of an overstretched move.
Earlier, analysts noted that Synchrony Financial maintained a generally bullish structure despite episodes of heightened selling pressure and short-term volatility. Now, with institutional and political investor activity shaping flows and the stock trading at fresh highs, traders should watch for a potential breakout above $82.19 or a reversal if support at $76 is breached.






Latest Synchrony Financial News




-
 Afghanistan
-
 Albania
-
 Algeria
-
 Angola
-
 Argentina
-
 Armenia
-
 Australia
-
 Austria
-
 Azerbaijan
-
 Bahamas
-
 Bahrain
-
 Bangladesh
-
 Belarus
-
 Belgium
-
 Bolivia
-
 Botswana
-
 Brazil
-
 Brunei
-
 Bulgaria
-
 Cambodia
-
 Cameroon
-
 Canada
-
 Chile
-
 China
-
 Colombia
-
 Congo
-
 Costa Rica
-
 Cote d'Ivoire
-
 Croatia
-
 Cuba
-
 Cyprus
-
 Czechia
-
 DR Congo
-
 Denmark
-
 Dominican Republic
-
 Ecuador
-
 Egypt
-
 El Salvador
-
 Estonia
-
 Eswatini
-
 Ethiopia
-
 Finland
-
 France
-
 Georgia
-
 Germany
-
 Ghana
-
 Greece
-
 Haiti
-
 Hong Kong
-
 Hungary
-
 India
-
 Indonesia
-
 Iran, Islamic republic
-
 Iraq
-
 Ireland
-
 Israel
-
 Italy
-
 Jamaica
-
 Japan
-
 Jordan
-
 Kazakhstan
-
 Kenya
-
 Korea
-
 Kuwait
-
 Kyrgyzstan
-
 Laos
-
 Latvia
-
 Lebanon
-
 Lesotho
-
 Libya
-
 Lithuania
-
 Luxembourg
-
 Madagascar
-
 Malaysia
-
 Malta
-
 Mauritius
-
 Mexico
-
 Moldova
-
 Mongolia
-
 Montenegro
-
 Morocco
-
 Mozambique
-
 Myanmar
-
 Namibia
-
 Nepal
-
 Netherlands
-
 New Zealand
-
 Nigeria
-
 North Macedonia
-
 Norway
-
 Oman
-
 Pakistan
-
 Palestine
-
 Panama
-
 Papua New Guinea
-
 Paraguay
-
 Peru
-
 Philippines
-
 Poland
-
 Portugal
-
 Puerto Rico
-
 Qatar
-
 Reunion
-
 Romania
-
 Rwanda
-
 Saudi Arabia
-
 Serbia
-
 Singapore
-
 Slovakia
-
 Slovenia
-
 Somalia
-
 South Africa
-
 Spain
-
 Sri Lanka
-
 Sweden
-
 Switzerland
-
 Syria
-
 Taiwan
-
 Tajikistan
-
 Tanzania
-
 Thailand
-
 Trinidad and Tobago
-
 Tunisia
-
 Turkey
-
 UAE
-
 Uganda
-
 Ukraine
-
 United Kingdom
-
United States
-
 Uruguay
-
 Uzbekistan
-
 Venezuela
-
 Vietnam
-
 Yemen
-
 Zambia
-
 Zimbabwe
- Forex
- Crypto












