

What's behind Synchrony Financial's latest stock pullback?

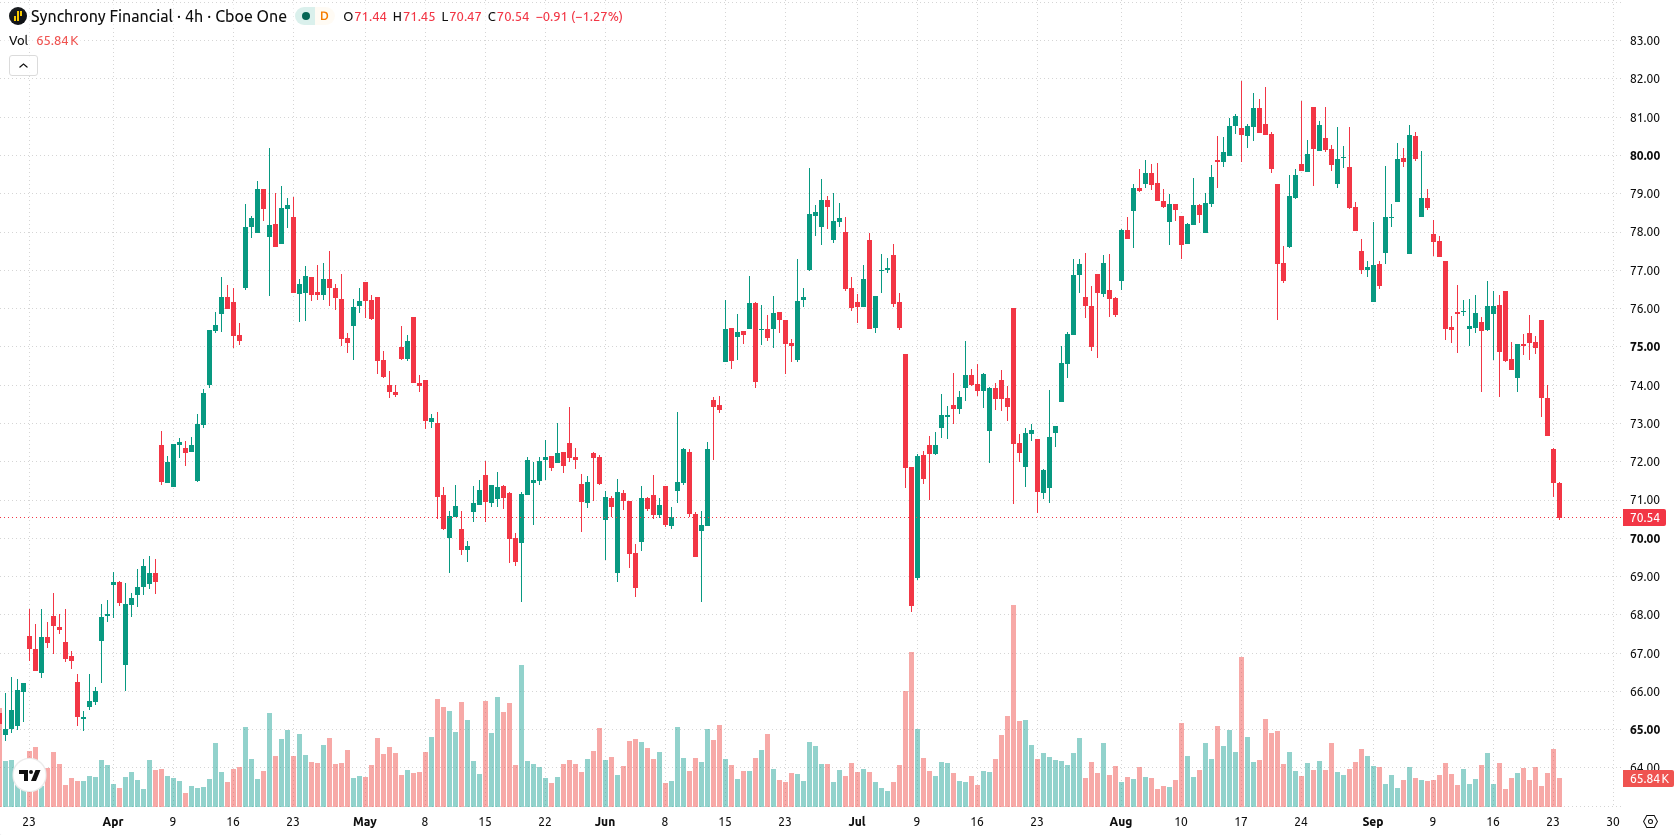
Synchrony Financial (SYF) slumped 2.92% as sellers intensified their grip, even as anticipation of the upcoming third quarter earnings release and ongoing share buybacks set a constructive corporate backdrop. The steep drop is supported by sustained bearish momentum, with shares trading below all key moving averages and sellers maintaining short- to long-term pressure.
 76.64
77.72
Highlights
- Synchrony Financial is set to report third quarter 2026 results on October 20, with a return on equity exceeding 20%.
- The company has pursued aggressive share buybacks and was ranked the top employer in the United States.
- Shares of Synchrony Financial have dropped 2.92% and trade below key moving averages, with high probability of further downside in the $68.49 to $72.2 range.
Buyback focus and strong returns fail to counter persistent bearish sentiment
Synchrony Financial is scheduled to report its third quarter 2026 financial results on October 20, 2026, with the earnings release and presentation materials to be posted on its Investor Relations website that morning. The company has maintained a strong return on equity above 20% and has emphasized aggressive share buybacks as part of its capital allocation strategy. It was recently ranked the #1 Best Company to Work For in the United States, though price action has remained under broader selling pressure.
Sustained oversold readings as prices breach key technical benchmarks
Synchrony Financial is trading below its 20-day, 50-day, and 200-day moving averages at $77.08, $76.97, and $75.1 respectively, highlighting strong seller control and a sustained bearish structure. Resistance is established at $70.79, with immediate support at $68.49. Momentum indicators remain negative: the MACD signals a sell, the ADX at 14.45 reflects a weak trend, and multiple oscillators—RSI at 34.18, CCI at -124.54, and Stochastic RSI at 0—confirm strong oversold pressure. Bull/Bear Power is marginally positive intraday at 0.17, set against persistent downside alignment in momentum and oscillators.
Earlier, analysts noted that Synchrony Financial had maintained a generally bullish technical structure despite concerns over volatility and institutional portfolio shifts. The current breakdown below major moving averages marks a clear change in trend, with the focus now on whether support at $68.49 can hold amid high downside risk into the upcoming earnings release.










-
 Afghanistan
-
 Albania
-
 Algeria
-
 Angola
-
 Argentina
-
 Armenia
-
 Australia
-
 Austria
-
 Azerbaijan
-
 Bahamas
-
 Bahrain
-
 Bangladesh
-
 Belarus
-
 Belgium
-
 Bolivia
-
 Botswana
-
 Brazil
-
 Brunei
-
 Bulgaria
-
 Cambodia
-
 Cameroon
-
 Canada
-
 Chile
-
 China
-
 Colombia
-
 Congo
-
 Costa Rica
-
 Cote d'Ivoire
-
 Croatia
-
 Cuba
-
 Cyprus
-
 Czechia
-
 DR Congo
-
 Denmark
-
 Dominican Republic
-
 Ecuador
-
 Egypt
-
 El Salvador
-
 Estonia
-
 Eswatini
-
 Ethiopia
-
 Finland
-
 France
-
 Georgia
-
 Germany
-
 Ghana
-
 Greece
-
 Haiti
-
 Hong Kong
-
 Hungary
-
 India
-
 Indonesia
-
 Iran, Islamic republic
-
 Iraq
-
 Ireland
-
 Israel
-
 Italy
-
 Jamaica
-
 Japan
-
 Jordan
-
 Kazakhstan
-
 Kenya
-
 Korea
-
 Kuwait
-
 Kyrgyzstan
-
 Laos
-
 Latvia
-
 Lebanon
-
 Lesotho
-
 Libya
-
 Lithuania
-
 Luxembourg
-
 Madagascar
-
 Malaysia
-
 Malta
-
 Mauritius
-
 Mexico
-
 Moldova
-
 Mongolia
-
 Montenegro
-
 Morocco
-
 Mozambique
-
 Myanmar
-
 Namibia
-
 Nepal
-
 Netherlands
-
 New Zealand
-
 Nigeria
-
 North Macedonia
-
 Norway
-
 Oman
-
 Pakistan
-
 Palestine
-
 Panama
-
 Papua New Guinea
-
 Paraguay
-
 Peru
-
 Philippines
-
 Poland
-
 Portugal
-
 Puerto Rico
-
 Qatar
-
 Reunion
-
 Romania
-
 Rwanda
-
 Saudi Arabia
-
 Serbia
-
 Singapore
-
 Slovakia
-
 Slovenia
-
 Somalia
-
 South Africa
-
 Spain
-
 Sri Lanka
-
 Sweden
-
 Switzerland
-
 Syria
-
 Taiwan
-
 Tajikistan
-
 Tanzania
-
 Thailand
-
 Trinidad and Tobago
-
 Tunisia
-
 Turkey
-
 UAE
-
 Uganda
-
 Ukraine
-
 United Kingdom
-
United States
-
 Uruguay
-
 Uzbekistan
-
 Venezuela
-
 Vietnam
-
 Yemen
-
 Zambia
-
 Zimbabwe
- Forex
- Crypto












