

Synchrony Financial shares drop more than 3% after strong selling pressure dominates despite bullish technicals

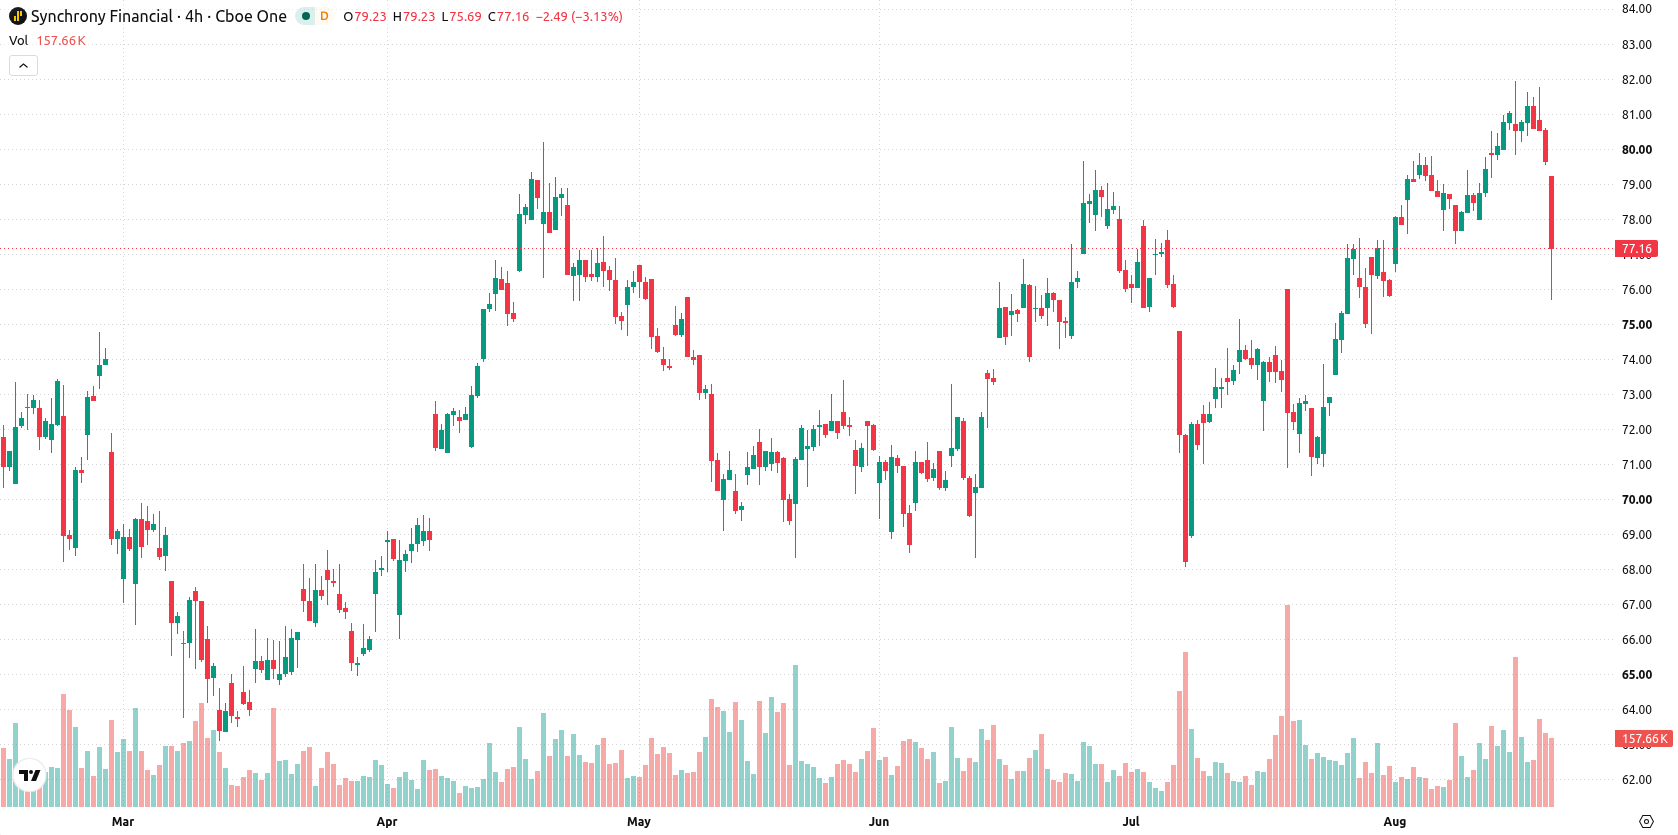
Synchrony Financial (SYF) dropped 3.34% as sellers intensified pressure following a downside gap at the open, with volatility elevating intraday swings. The decline is not fully confirmed by technical signals, which still show several bullish momentum readings and medium-term support remains intact above key moving averages.
 75.86
75.86
75.86
75.86
Highlights
- Shares of Synchrony Financial are trading at $76.96, down 3.34% on the day with visible selling pressure after the open.
- The stock sits just below short-term resistance at $77.83 and above key support at $76.29, with the broader range expected from $72.28 to $78.16 over the next five days.
- Bullish momentum signals dominate medium and long-term outlooks, though some overbought readings and today’s weakness indicate potential for short-term consolidation.
Bullish structure persists as SYF holds above key moving averages
SYF is trading just below the 20-day moving average at $77.83, maintaining a position above the 50-day at $75.75 and the 200-day at $74.80. This moving average structure reflects ongoing medium- and long-term bullish sentiment, while short-term resistance emerges near $77.83 and support stands at $76.29, anchored by the Ichimoku Kijun. Momentum indicators remain relatively strong: the MACD remains in buy territory, the Average Directional Index is neutral, and both the RSI (58.64) and CCI (81.85) project mild buy signals. The Stochastic RSI remains neutral at 40.37. Intraday momentum shows buyers still have an edge, as highlighted by the Bull/Bear Power and the bullish Awesome Oscillator, although today's session has seen increased selling pressure and price mid-range for the day.
Earlier, analysts noted that Synchrony Financial was displaying a bearish technical structure, with sellers maintaining control as the stock traded below key moving averages. With the stock now holding above its medium- and long-term moving averages despite ongoing short-term volatility, traders should focus on the $76.29 support level for signs of a potential downside shift if selling pressure persists.





Latest Synchrony Financial News





-
 Afghanistan
-
 Albania
-
 Algeria
-
 Angola
-
 Argentina
-
 Armenia
-
 Australia
-
 Austria
-
 Azerbaijan
-
 Bahamas
-
 Bahrain
-
 Bangladesh
-
 Belarus
-
 Belgium
-
 Bolivia
-
 Botswana
-
 Brazil
-
 Brunei
-
 Bulgaria
-
 Cambodia
-
 Cameroon
-
 Canada
-
 Chile
Chile
-
 China
China
-
 Colombia
-
 Congo
Congo
-
 Costa Rica
-
 Cote d'Ivoire
-
 Croatia
-
 Cuba
Cuba
-
 Cyprus
-
 Czechia
-
 DR Congo
-
 Denmark
-
 Dominican Republic
-
 Ecuador
-
 Egypt
Egypt
-
 El Salvador
-
 Estonia
-
 Eswatini
-
 Ethiopia
-
 Finland
-
 France
-
 Georgia
-
 Germany
-
 Ghana
Ghana
-
 Greece
-
 Haiti
Haiti
-
 Hong Kong
-
 Hungary
-
 India
India
-
 Indonesia
-
 Iran, Islamic republic
-
 Iraq
Iraq
-
 Ireland
-
 Israel
-
 Italy
Italy
-
 Jamaica
-
 Japan
Japan
-
 Jordan
-
 Kazakhstan
-
 Kenya
Kenya
-
 Korea
Korea
-
 Kuwait
-
 Kyrgyzstan
-
 Laos
Laos
-
 Latvia
-
 Lebanon
-
 Lesotho
-
 Libya
Libya
-
 Lithuania
-
 Luxembourg
-
 Madagascar
-
 Malaysia
-
 Malta
Malta
-
 Mauritius
-
 Mexico
-
 Moldova
-
 Mongolia
-
 Montenegro
-
 Morocco
-
 Mozambique
-
 Myanmar
-
 Namibia
-
 Nepal
Nepal
-
 Netherlands
-
 New Zealand
-
 Nigeria
-
 North Macedonia
-
 Norway
-
 Oman
Oman
-
 Pakistan
-
 Palestine
-
 Panama
-
 Papua New Guinea
-
 Paraguay
-
 Peru
Peru
-
 Philippines
-
 Poland
-
 Portugal
-
 Puerto Rico
-
 Qatar
Qatar
-
 Reunion
-
 Romania
-
 Rwanda
-
 Saudi Arabia
-
 Serbia
-
 Singapore
-
 Slovakia
-
 Slovenia
-
 Somalia
-
 South Africa
-
 Spain
Spain
-
 Sri Lanka
-
 Sweden
-
 Switzerland
-
 Syria
Syria
-
 Taiwan
-
 Tajikistan
-
 Tanzania
-
 Thailand
-
 Trinidad and Tobago
-
 Tunisia
-
 Turkey
-
 UAE
UAE
-
 Uganda
-
 Ukraine
-
 United Kingdom
-
United States
-
 Uruguay
-
 Uzbekistan
-
 Venezuela
-
 Vietnam
-
 Yemen
Yemen
-
 Zambia
-
 Zimbabwe
- Forex
- Crypto












