


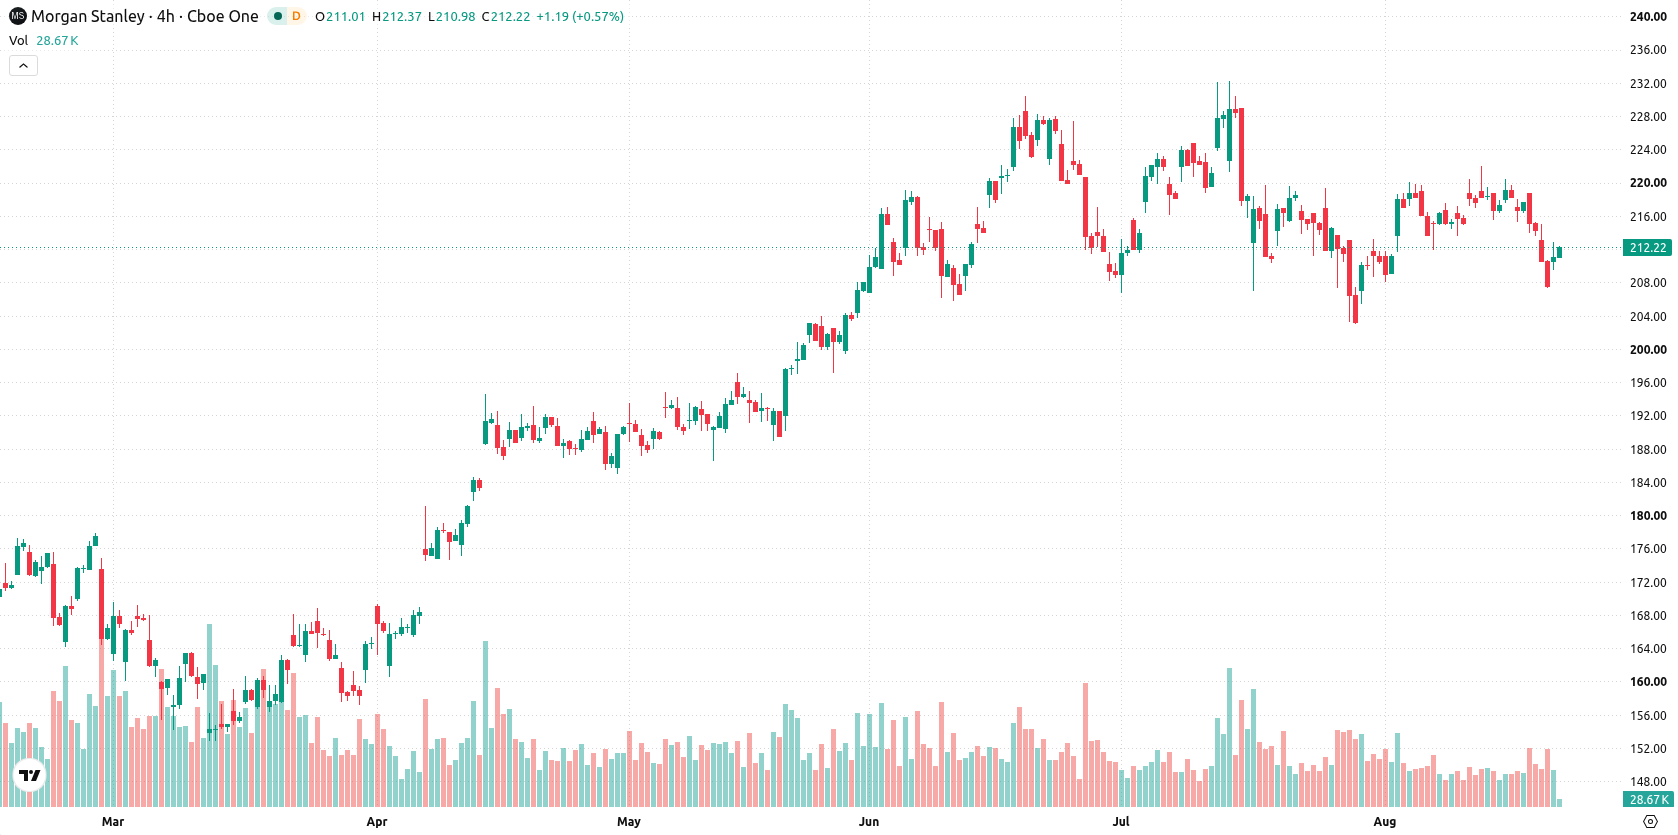
Morgan Stanley (MS) climbed 2.58% after an upside gap, with the move coming even as recent macroeconomic uncertainty and technical support levels weighed on the broader backdrop. The rebound looks limited, with MS still trading below its 20-day and 50-day moving averages, indicating persistent short-term and medium-term downward pressure.
 186.99
193.06
Highlights
- Morgan Stanley faces increased market activity with institutions shifting into defensive assets due to macroeconomic uncertainty and a technical support breach.
- The U.S. Treasury will increase liquidity support repo operations for longer-term maturities to at least $4 billion per operation from September 9, 2026.
- Morgan Stanley stock trades below short- and medium-term moving averages with technical indicators showing strong downside momentum and an expected trading range of $206.2 to $219.42 over the next five days.
Defensive flows rise amid macro uncertainty and support breach
Morgan Stanley experienced renewed market activity as macroeconomic uncertainty and a breach of technical support triggered institutional reallocations into defensive assets. The firm's research noted that the U.S. Treasury will increase the size of its liquidity support repurchase operations for longer-term maturities to at least $4 billion per operation, effective September 9, 2026. Additionally, 13F filings disclosed MS’s minor ownership of 7,037 XRP ETF shares across three funds, which remains immaterial relative to its total assets.
Oversold momentum emerges as resistance blocks near-term gains
Morgan Stanley is currently trading below the 20-day ($214.11) and 50-day ($216.68) moving averages, yet remains well above the 200-day ($188.17). This setup reflects short- and medium-term downside technical pressure, while long-term alignment is still bullish. Resistance is visible near $214.11 and immediate support stands at $212.79. Momentum signals are mostly negative, with MACD and ADX neutral, but the RSI, CCI, and BBP all indicate selling pressure or an oversold state. BBP’s negative value points to sellers in control, and both the Stochastic RSI and BBP highlight an oversold environment. The Awesome Oscillator also signals strong downside momentum. Despite these bearish technicals, today’s price closed near session highs, with late-session strength contradicting most momentum indicators.
Earlier, analysts noted that Morgan Stanley’s technical setup and momentum indicators pointed to an ongoing bearish scenario, with downside risks heightened if key support levels were breached. The current analysis adds a layer of caution by highlighting persistent short- and medium-term pressure despite today’s rebound, underscoring $214.11 as a key resistance level that could shift the outlook if decisively broken.










-
 Afghanistan
-
 Albania
-
 Algeria
-
 Angola
-
 Argentina
-
 Armenia
-
 Australia
-
 Austria
-
 Azerbaijan
-
 Bahamas
-
 Bahrain
-
 Bangladesh
-
 Belarus
-
 Belgium
-
 Bolivia
-
 Botswana
-
 Brazil
-
 Brunei
-
 Bulgaria
-
 Cambodia
-
 Cameroon
-
 Canada
-
 Chile
-
 China
-
 Colombia
-
 Congo
-
 Costa Rica
-
 Cote d'Ivoire
-
 Croatia
-
 Cuba
-
 Cyprus
-
 Czechia
-
 DR Congo
-
 Denmark
-
 Dominican Republic
-
 Ecuador
-
 Egypt
-
 El Salvador
-
 Estonia
-
 Eswatini
-
 Ethiopia
-
 Finland
-
 France
-
 Georgia
-
 Germany
-
 Ghana
-
 Greece
-
 Haiti
-
 Hong Kong
-
 Hungary
-
 India
-
 Indonesia
-
 Iran, Islamic republic
-
 Iraq
-
 Ireland
-
 Israel
-
 Italy
-
 Jamaica
-
 Japan
-
 Jordan
-
 Kazakhstan
-
 Kenya
-
 Korea
-
 Kuwait
-
 Kyrgyzstan
-
 Laos
-
 Latvia
-
 Lebanon
-
 Lesotho
-
 Libya
-
 Lithuania
-
 Luxembourg
-
 Madagascar
-
 Malaysia
-
 Malta
-
 Mauritius
-
 Mexico
-
 Moldova
-
 Mongolia
-
 Montenegro
-
 Morocco
-
 Mozambique
-
 Myanmar
-
 Namibia
-
 Nepal
-
 Netherlands
-
 New Zealand
-
 Nigeria
-
 North Macedonia
-
 Norway
-
 Oman
-
 Pakistan
-
 Palestine
-
 Panama
-
 Papua New Guinea
-
 Paraguay
-
 Peru
-
 Philippines
-
 Poland
-
 Portugal
-
 Puerto Rico
-
 Qatar
-
 Reunion
-
 Romania
-
 Rwanda
-
 Saudi Arabia
-
 Serbia
-
 Singapore
-
 Slovakia
-
 Slovenia
-
 Somalia
-
 South Africa
-
 Spain
-
 Sri Lanka
-
 Sweden
-
 Switzerland
-
 Syria
-
 Taiwan
-
 Tajikistan
-
 Tanzania
-
 Thailand
-
 Trinidad and Tobago
-
 Tunisia
-
 Turkey
-
 UAE
-
 Uganda
-
 Ukraine
-
 United Kingdom
-
United States
-
 Uruguay
-
 Uzbekistan
-
 Venezuela
-
 Vietnam
-
 Yemen
-
 Zambia
-
 Zimbabwe
- Forex
- Crypto












