

Six new satellites launched: Can AST SpaceMobile stock break $81.66 resistance?

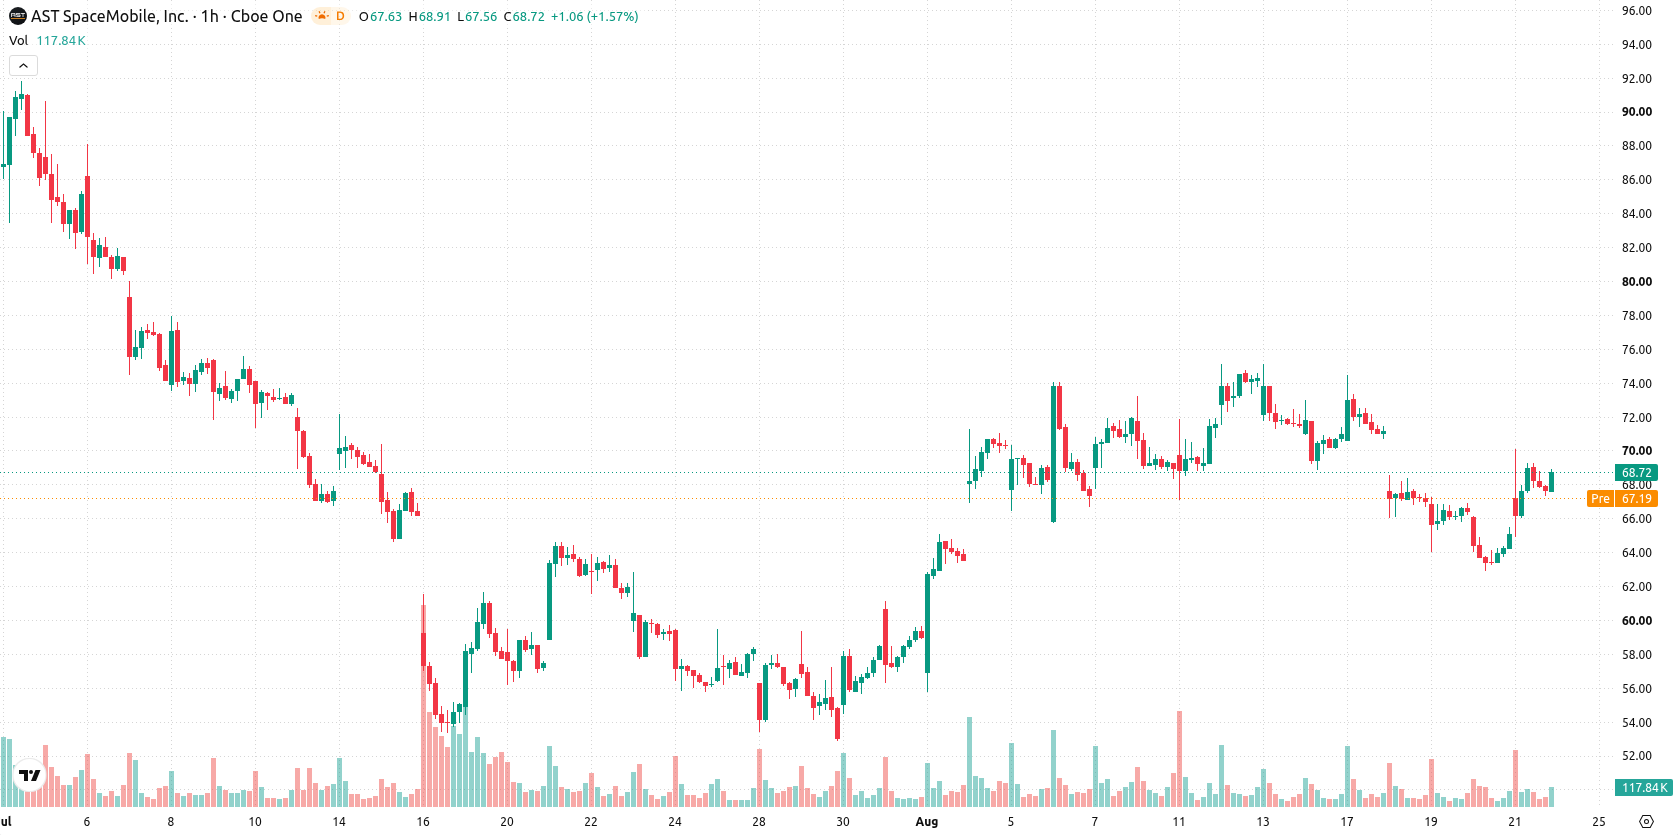
AST SpaceMobile (ASTS) stock is trading at $68.65, up 5.52% on the day, and sits above its key moving averages.
 41.20
44.82
Highlights
- AST SpaceMobile reported Q2 2026 revenues of $31.5 million and expanded its satellite fleet to 13 units.
- The company holds a $1.3 billion contracted backlog, with over $125 million in U.S. government awards and a preliminary $1 billion selection for Japan’s J-LEO program.
- Shares of AST SpaceMobile show short- and medium-term bullish momentum, with buyer dominance and a projected price range of $63.48 to $73.82 in the next three days.
Satellite expansion and contract wins boost commercial outlook
AST SpaceMobile reported revenues of $31.5 million in Q2 2026, demonstrating ongoing commercial traction and increasing operational liquidity. In addition, the company recently expanded its satellite network to 13 with the launch of six new satellites within two months, a development that Tradingkey notes could enhance AST SpaceMobile’s ability to generate service revenues and improve its competitive profile. The presence of a $1.3 billion contracted backlog, including over $125 million in U.S. government awards and a preliminary $1 billion selection for Japan’s J-LEO program, further signals robust future revenue streams and long-term business visibility.
Mixed momentum and overbought signals raise pullback risk
Technically, ASTS is trading above its MA-20 at $66.05 and MA-50 at $68.65 on the hourly chart, while staying below the long-term MA-200 at $81.66. The Ichimoku Kijun acts as immediate support at $66.5. Momentum signals are mixed: ADX indicates a Buy, suggesting an emerging trend, while MACD remains Neutral. RSI is at 58.52, offering a Buy signal, but Stoch RSI, CCI, and Bull/Bear Power all register overbought conditions, flagging strong buyer dominance and potential for exhaustion. The Awesome Oscillator supports the prevailing uptrend, though conflicting signals highlight the risk of a short-term pullback.
Upside bias persists with consolidation risk near support
Over the next 2-3 trading days, ASTS is expected to trade within a $63.48 to $73.82 range. There is a 70% probability of further upside, versus a 30% probability of a downward move. In the baseline scenario, price may consolidate between near-term support and resistance; a decisive break above resistance would set up a move toward the range high, while a breach of support at the Ichimoku Kijun could accelerate declines toward the forecast low.
Earlier, analysts noted that AST SpaceMobile faced technical and liquidity pressures, supporting a broadly cautious outlook for the stock despite recent revenue and contract gains. The latest expansion of the satellite network and a growing backlog strengthen the company’s long-term business case, but traders should monitor for potential price consolidation or a breakout toward the $73.82 range high in the coming sessions.









-
 Afghanistan
-
 Albania
-
 Algeria
-
 Angola
-
 Argentina
-
 Armenia
-
 Australia
-
 Austria
-
 Azerbaijan
-
 Bahamas
-
 Bahrain
-
 Bangladesh
-
 Belarus
-
 Belgium
-
 Bolivia
-
 Botswana
-
 Brazil
-
 Brunei
-
 Bulgaria
-
 Cambodia
-
 Cameroon
-
 Canada
-
 Chile
-
 China
-
 Colombia
-
 Congo
-
 Costa Rica
-
 Cote d'Ivoire
-
 Croatia
-
 Cuba
-
 Cyprus
-
 Czechia
-
 DR Congo
-
 Denmark
-
 Dominican Republic
-
 Ecuador
-
 Egypt
-
 El Salvador
-
 Estonia
-
 Eswatini
-
 Ethiopia
-
 Finland
-
 France
-
 Georgia
-
 Germany
-
 Ghana
-
 Greece
-
 Haiti
-
 Hong Kong
-
 Hungary
-
 India
-
 Indonesia
-
 Iran, Islamic republic
-
 Iraq
-
 Ireland
-
 Israel
-
 Italy
-
 Jamaica
-
 Japan
-
 Jordan
-
 Kazakhstan
-
 Kenya
-
 Korea
-
 Kuwait
-
 Kyrgyzstan
-
 Laos
-
 Latvia
-
 Lebanon
-
 Lesotho
-
 Libya
-
 Lithuania
-
 Luxembourg
-
 Madagascar
-
 Malaysia
-
 Malta
-
 Mauritius
-
 Mexico
-
 Moldova
-
 Mongolia
-
 Montenegro
-
 Morocco
-
 Mozambique
-
 Myanmar
-
 Namibia
-
 Nepal
-
 Netherlands
-
 New Zealand
-
 Nigeria
-
 North Macedonia
-
 Norway
-
 Oman
-
 Pakistan
-
 Palestine
-
 Panama
-
 Papua New Guinea
-
 Paraguay
-
 Peru
-
 Philippines
-
 Poland
-
 Portugal
-
 Puerto Rico
-
 Qatar
-
 Reunion
-
 Romania
-
 Rwanda
-
 Saudi Arabia
-
 Serbia
-
 Singapore
-
 Slovakia
-
 Slovenia
-
 Somalia
-
 South Africa
-
 Spain
-
 Sri Lanka
-
 Sweden
-
 Switzerland
-
 Syria
-
 Taiwan
-
 Tajikistan
-
 Tanzania
-
 Thailand
-
 Trinidad and Tobago
-
 Tunisia
-
 Turkey
-
 UAE
-
 Uganda
-
 Ukraine
-
 United Kingdom
-
United States
-
 Uruguay
-
 Uzbekistan
-
 Venezuela
-
 Vietnam
-
 Yemen
-
 Zambia
-
 Zimbabwe
- Forex
- Crypto












