

-1.21% for Tesla stock as President Trump 50% Canadian import tariff drives losses

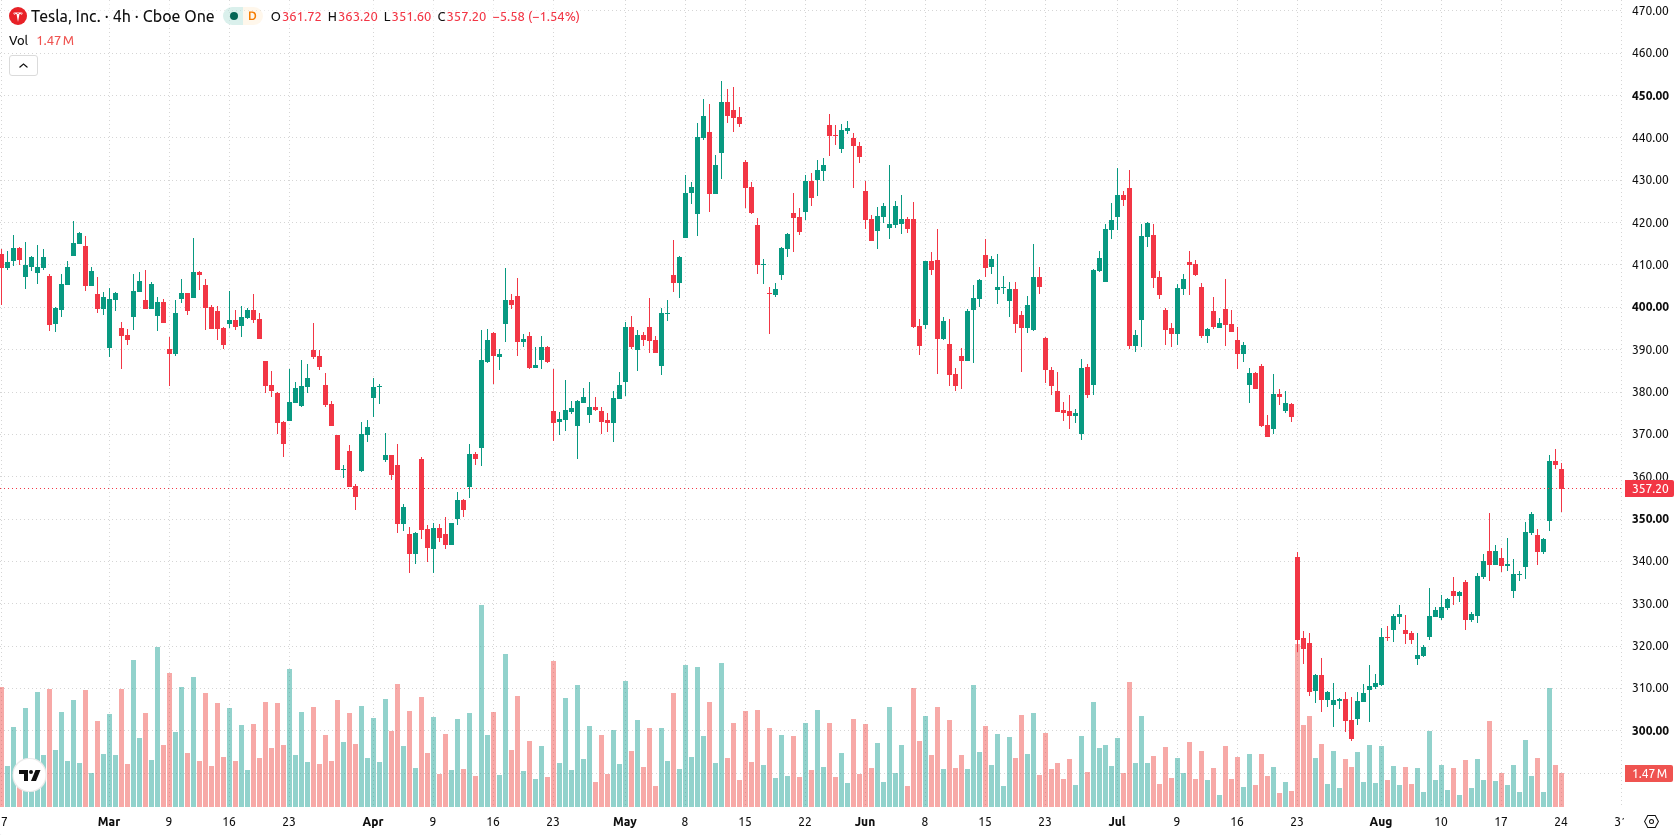
Tesla (TSLA) stock is trading at $358.1, showing a daily decline of 1.21% and positioning mid-range for the session within pronounced volatility. The price sits above its short- and medium-term moving averages but remains beneath longer-term levels.
 403.82
408.36
Highlights
- President Trump announced a 50% tariff on all Canadian imports, affecting U.S. automakers including Tesla through higher production costs.
- Tesla faces higher input costs and potential changes in competitive dynamics, impacting sector profitability and triggering a broad selloff in auto and EV stocks.
- Tesla stock is projected to consolidate in the $340.47 to $375.74 range over the next few days, with technical signals suggesting elevated buying but risk of a short-term pullback.
Auto sector sentiment turns bearish as Trump tariff heightens supply risk
The announcement by President Trump of a 50% tariff on all Canadian imports, including vehicles, automotive components, and steel, has introduced substantial supply chain and cost structure risks to U.S. automakers, according to Investing.com. This development has triggered broad negative sentiment toward the auto and EV sectors, as market participants reassess the impact on profitability, production costs, and pricing strategies. Tesla, as a leading U.S. EV manufacturer, is directly exposed to these challenges through both input price inflation and possible shifts in competitive dynamics, amplifying the sector-wide selloff.
Upside momentum faces resistance as overbought signals intensify
Technically, TSLA is trading above the MA-20 at $339.99 and MA-50 at $332.37, but remains below the long-term MA-200 at $403.27. The Ichimoku Kijun level at $340.96 serves as immediate support. Momentum indicators give a mixed picture: MACD signals ongoing buying interest, while ADX is neutral, reflecting trend indecision. RSI stands at 68.19, placing it in the buy zone, yet Stoch RSI, CCI, and Bull/Bear Power are all overbought, indicating strong buyer dominance but an elevated risk of a short-term pullback. The Awesome Oscillator aligns with the upside bias.
Consolidation likely as volatility bands define short-term range
Looking ahead to the next two to three trading days, the expected price range for TSLA is $340.47 to $375.74, a volatility band relative to current levels. Model scenarios assign a 62% probability to an upward continuation within this range, while the bearish scenario, with a 38% likelihood, would see price break below $340.47 and test lower support. The baseline expectation is for consolidation within this corridor unless a new catalyst shifts momentum.
Earlier, analysts noted that while Tesla faced regulatory and operational challenges, the technical outlook pointed to consolidation within a volatile trading corridor. The current analysis underscores this uncertain environment by introducing new supply chain headwinds from tariffs, making the $340.96 Ichimoku Kijun an essential support level for traders monitoring near-term downside risk.











-
 Afghanistan
-
 Albania
-
 Algeria
-
 Angola
-
 Argentina
-
 Armenia
-
 Australia
-
 Austria
-
 Azerbaijan
-
 Bahamas
-
 Bahrain
-
 Bangladesh
-
 Belarus
-
 Belgium
-
 Bolivia
-
 Botswana
-
 Brazil
-
 Brunei
-
 Bulgaria
-
 Cambodia
-
 Cameroon
-
 Canada
-
 Chile
-
 China
-
 Colombia
-
 Congo
-
 Costa Rica
-
 Cote d'Ivoire
-
 Croatia
-
 Cuba
-
 Cyprus
-
 Czechia
-
 DR Congo
-
 Denmark
-
 Dominican Republic
-
 Ecuador
-
 Egypt
-
 El Salvador
-
 Estonia
-
 Eswatini
-
 Ethiopia
-
 Finland
-
 France
-
 Georgia
-
 Germany
-
 Ghana
-
 Greece
-
 Haiti
-
 Hong Kong
-
 Hungary
-
 India
-
 Indonesia
-
 Iran, Islamic republic
-
 Iraq
-
 Ireland
-
 Israel
-
 Italy
-
 Jamaica
-
 Japan
-
 Jordan
-
 Kazakhstan
-
 Kenya
-
 Korea
-
 Kuwait
-
 Kyrgyzstan
-
 Laos
-
 Latvia
-
 Lebanon
-
 Lesotho
-
 Libya
-
 Lithuania
-
 Luxembourg
-
 Madagascar
-
 Malaysia
-
 Malta
-
 Mauritius
-
 Mexico
-
 Moldova
-
 Mongolia
-
 Montenegro
-
 Morocco
-
 Mozambique
-
 Myanmar
-
 Namibia
-
 Nepal
-
 Netherlands
-
 New Zealand
-
 Nigeria
-
 North Macedonia
-
 Norway
-
 Oman
-
 Pakistan
-
 Palestine
-
 Panama
-
 Papua New Guinea
-
 Paraguay
-
 Peru
-
 Philippines
-
 Poland
-
 Portugal
-
 Puerto Rico
-
 Qatar
-
 Reunion
-
 Romania
-
 Rwanda
-
 Saudi Arabia
-
 Serbia
-
 Singapore
-
 Slovakia
-
 Slovenia
-
 Somalia
-
 South Africa
-
 Spain
-
 Sri Lanka
-
 Sweden
-
 Switzerland
-
 Syria
-
 Taiwan
-
 Tajikistan
-
 Tanzania
-
 Thailand
-
 Trinidad and Tobago
-
 Tunisia
-
 Turkey
-
 UAE
-
 Uganda
-
 Ukraine
-
 United Kingdom
-
United States
-
 Uruguay
-
 Uzbekistan
-
 Venezuela
-
 Vietnam
-
 Yemen
-
 Zambia
-
 Zimbabwe
- Forex
- Crypto












