

INTU pulls back as restructuring charge pressures support test

Intuit (INTU) stock is trading at $342.54, down 4.17% on the day. The price is positioned below its key moving averages, indicating sustained short-term selling pressure.
 341.50
351.39
Highlights
- Intuit posted fiscal Q4 2026 earnings of $4.03 per share and $4.35 billion in revenue, beating analyst forecasts.
- The company increased its quarterly dividend by 15% to $1.38 per share, approved an $8 billion share buyback, and announced a 17% workforce reduction with a $300 to $340 million restructuring charge.
- Shares of Intuit trade below key moving averages with oversold signals dominant, and price is expected to range from $334.96 to $365.6 over the next 2 to 3 days.
Shareholder rewards and cost cuts as earnings beat estimates
Intuit posted fiscal fourth-quarter 2026 earnings of $4.03 per share and revenue of $4.35 billion, both exceeding analyst estimates and emphasizing recent operational outperformance, according to Finance Yahoo. Alongside this, the board approved a 15% increase in the quarterly dividend to $1.38 per share payable October 16, 2026, and authorized an $8 billion share buyback, both measures aimed at enhancing shareholder returns. The quarter also saw the announcement of a 17% workforce reduction and a $300 to $340 million restructuring charge, moves which underscore a shift towards aggressive cost management and potential business realignment, as reported by 247wallst.
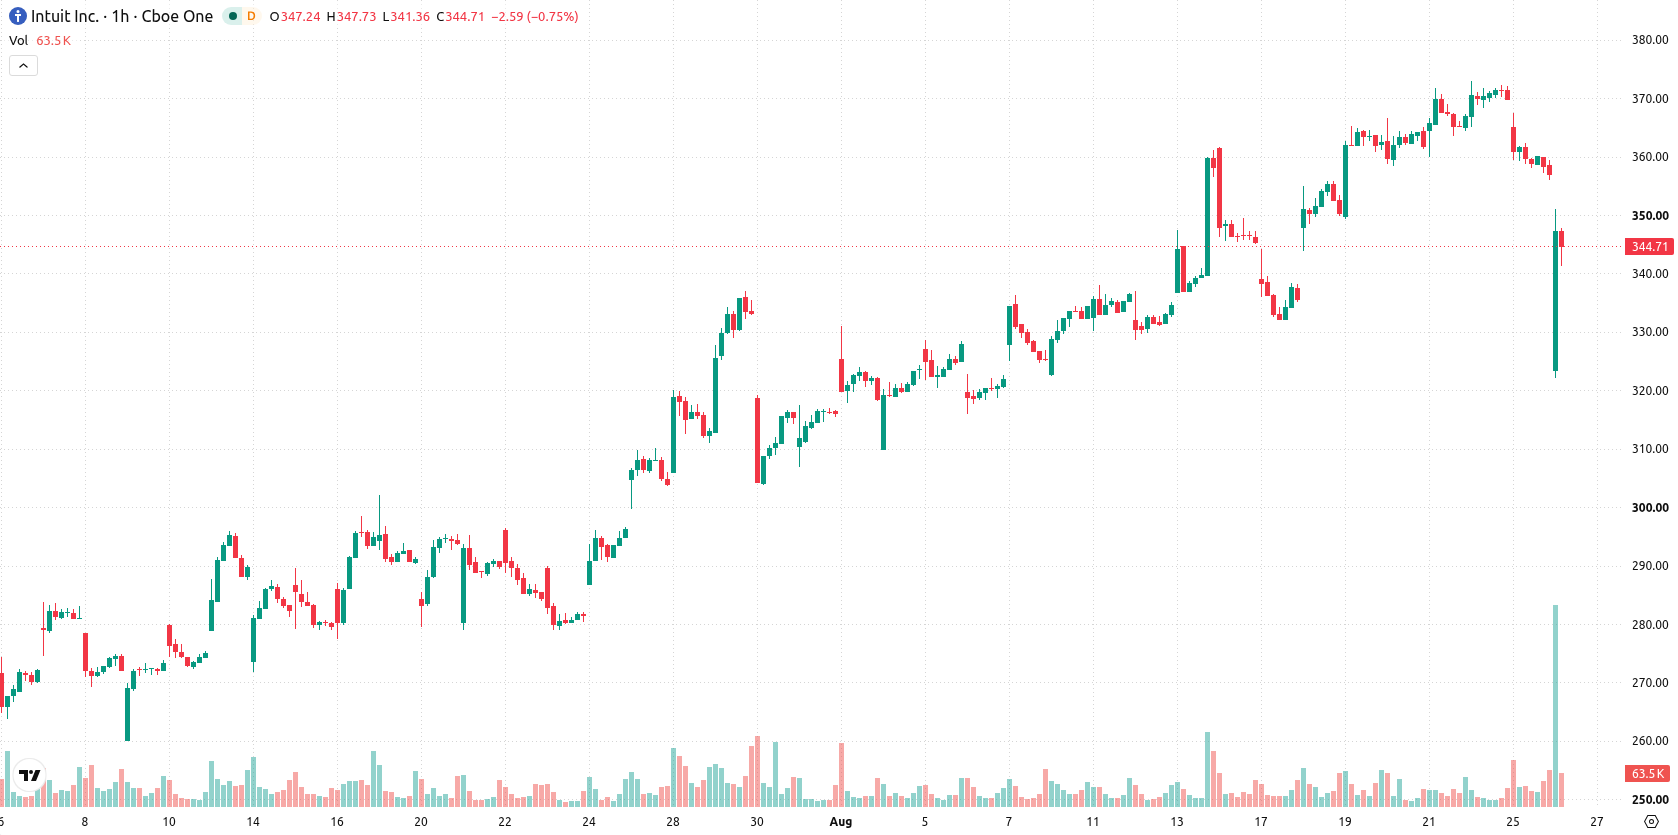
Intraday seller pressure as oscillators flash oversold signals
On the h1 timeframe, INTU trades below the MA-20 at $365.5 and the MA-50 at $358.71, with the price well under the long-term MA-200 at $440.99. Resistance lies immediately at the Ichimoku Kijun level of $364.5, while support is set at $334.96. Momentum indicators are mixed: MACD is Neutral, ADX signals a Buy, RSI is at 38.59, and both Stoch RSI and CCI are oversold. Bull/Bear Power also highlights oversold conditions, and the Awesome Oscillator confirms a negative trend. Together, the readings suggest strong intraday seller dominance with several oscillators in oversold territory, despite divergent momentum signals.
Consolidation likely as upside breakout odds remain limited
Over the next 2–3 sessions, price action is expected to stay within the $334.96 to $365.6 range, representing the typical volatility band seen at current levels. The probability of a bullish breakout above $364.5 is capped at 35%, making a further move lower more likely at 65%. If INTU decisively breaks above the Kijun level, room opens for a rebound, while a drop below $334.96 would expose the stock to deeper declines. The baseline scenario calls for consolidation within the established range.
Earlier, analysts noted that Intuit faced persistent long-term technical challenges despite pockets of short- and medium-term strength. The current analysis underscores that INTU remains vulnerable to further downside, with sellers dominant and the risk of a breakdown increasing if support at $334.96 fails in the near term.











-
 Afghanistan
-
 Albania
-
 Algeria
-
 Angola
-
 Argentina
-
 Armenia
-
 Australia
-
 Austria
-
 Azerbaijan
-
 Bahamas
-
 Bahrain
-
 Bangladesh
-
 Belarus
-
 Belgium
-
 Bolivia
-
 Botswana
-
 Brazil
-
 Brunei
-
 Bulgaria
-
 Cambodia
-
 Cameroon
-
 Canada
-
 Chile
-
 China
-
 Colombia
-
 Congo
-
 Costa Rica
-
 Cote d'Ivoire
-
 Croatia
-
 Cuba
-
 Cyprus
-
 Czechia
-
 DR Congo
-
 Denmark
-
 Dominican Republic
-
 Ecuador
-
 Egypt
-
 El Salvador
-
 Estonia
-
 Eswatini
-
 Ethiopia
-
 Finland
-
 France
-
 Georgia
-
 Germany
-
 Ghana
-
 Greece
-
 Haiti
-
 Hong Kong
-
 Hungary
-
 India
-
 Indonesia
-
 Iran, Islamic republic
-
 Iraq
-
 Ireland
-
 Israel
-
 Italy
-
 Jamaica
-
 Japan
-
 Jordan
-
 Kazakhstan
-
 Kenya
-
 Korea
-
 Kuwait
-
 Kyrgyzstan
-
 Laos
-
 Latvia
-
 Lebanon
-
 Lesotho
-
 Libya
-
 Lithuania
-
 Luxembourg
-
 Madagascar
-
 Malaysia
-
 Malta
-
 Mauritius
-
 Mexico
-
 Moldova
-
 Mongolia
-
 Montenegro
-
 Morocco
-
 Mozambique
-
 Myanmar
-
 Namibia
-
 Nepal
-
 Netherlands
-
 New Zealand
-
 Nigeria
-
 North Macedonia
-
 Norway
-
 Oman
-
 Pakistan
-
 Palestine
-
 Panama
-
 Papua New Guinea
-
 Paraguay
-
 Peru
-
 Philippines
-
 Poland
-
 Portugal
-
 Puerto Rico
-
 Qatar
-
 Reunion
-
 Romania
-
 Rwanda
-
 Saudi Arabia
-
 Serbia
-
 Singapore
-
 Slovakia
-
 Slovenia
-
 Somalia
-
 South Africa
-
 Spain
-
 Sri Lanka
-
 Sweden
-
 Switzerland
-
 Syria
-
 Taiwan
-
 Tajikistan
-
 Tanzania
-
 Thailand
-
 Trinidad and Tobago
-
 Tunisia
-
 Turkey
-
 UAE
-
 Uganda
-
 Ukraine
-
 United Kingdom
-
United States
-
 Uruguay
-
 Uzbekistan
-
 Venezuela
-
 Vietnam
-
 Yemen
-
 Zambia
-
 Zimbabwe
- Forex
- Crypto












