

What's behind Ericsson's latest 3.6% stock pullback?

Telefonaktiebolaget L M Ericsson ADR (ERIC) slumped 3.56% today as persistent downside momentum and seller dominance shaped trading action. The decline is reinforced by a bearish technical structure, with prices staying below all key moving averages.
 11.09
11.12
Highlights
- Shares of Ericsson trade below key moving averages, showing sustained pressure from sellers across all observed time frames.
- Technical indicators present mixed signals, with MACD showing strong downside momentum and overbought flags from Stochastic RSI and CCI.
- The stock is projected to remain between $9.76 and $10.16 in the next five sessions, with a slight tilt toward downside risk.
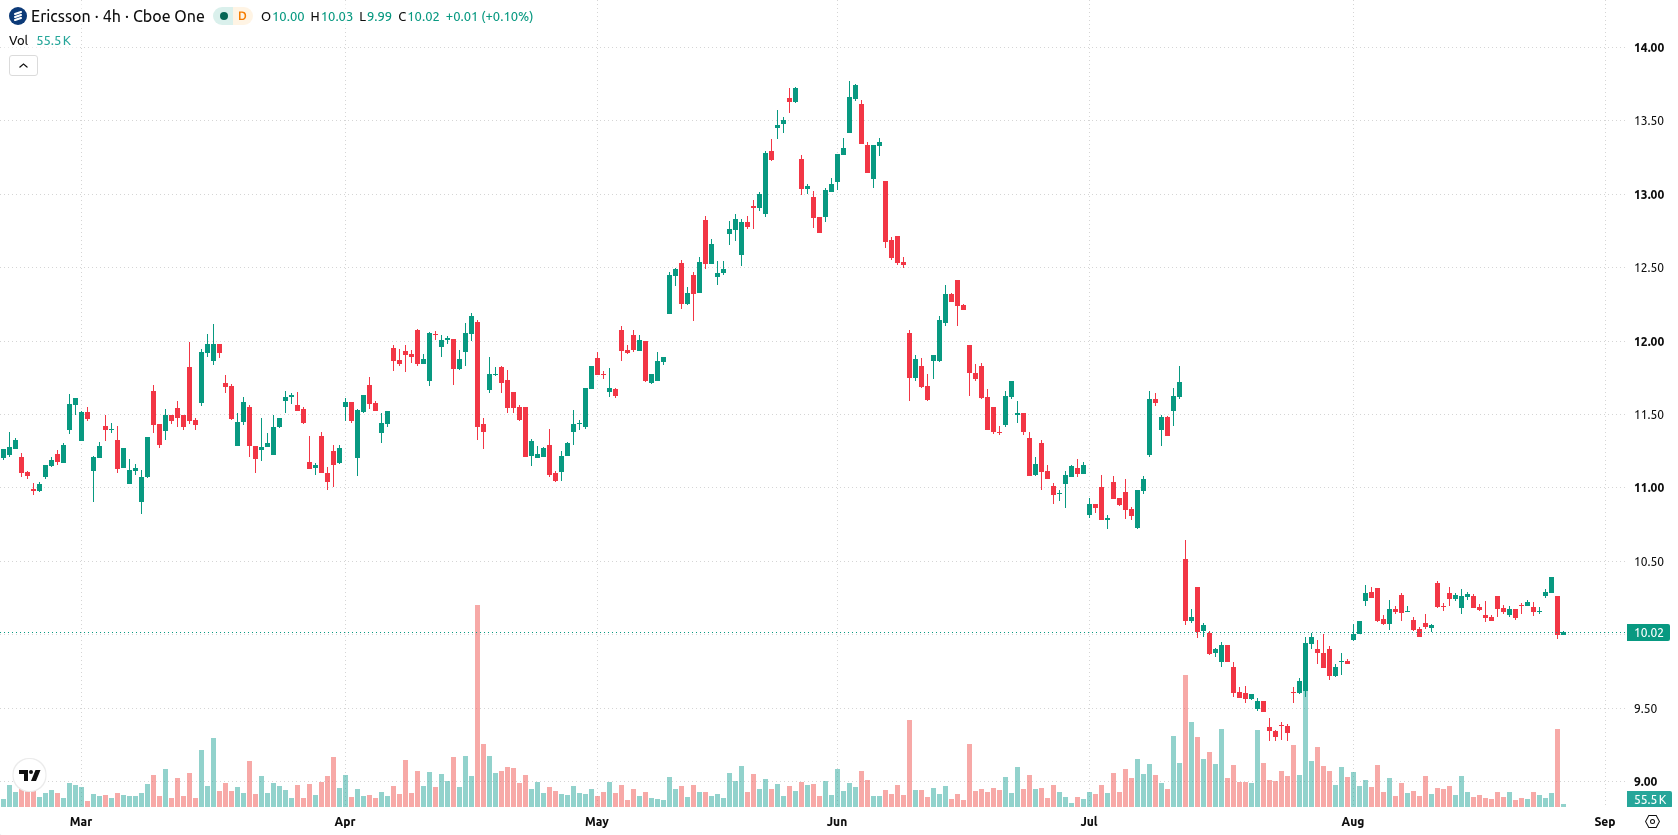
Bearish trend persists as mixed momentum complicates outlook
Ericsson is trading below its 20-day, 50-day, and 200-day moving averages at $10.11, $10.47, and $10.86, respectively, pointing to sustained selling pressure across all observed timeframes. Support is found at $9.98 and resistance at $10.1, with the overall trend remaining bearish. Momentum indicators show mixed signals: the MACD points to strong sell momentum, while the ADX is neutral, suggesting an indecisive overall trend. Both the Stochastic RSI at 100 and the CCI at 130.01 indicate overbought conditions, whereas the RSI is more neutral at 54.22. Bulls currently have a slight intraday advantage as per the BBP at 0.22 and a positive Awesome Oscillator, even as the stock remains pressured close to intraday lows.
Earlier, analysts noted that Ericsson stock was likely to remain rangebound amid balanced breakout risks and subdued volatility. The latest price action, with decisive downside momentum and persistent pressure below key moving averages, now puts the focus on $9.76 as a critical support level to monitor for any further weakness.






Latest Telefonaktiebolaget L M Ericsson ADR News



-
 Afghanistan
-
 Albania
-
 Algeria
-
 Angola
-
 Argentina
-
 Armenia
-
 Australia
-
 Austria
-
 Azerbaijan
-
 Bahamas
-
 Bahrain
-
 Bangladesh
-
 Belarus
-
 Belgium
-
 Bolivia
-
 Botswana
-
 Brazil
-
 Brunei
-
 Bulgaria
-
 Cambodia
-
 Cameroon
-
 Canada
-
 Chile
-
 China
-
 Colombia
-
 Congo
-
 Costa Rica
-
 Cote d'Ivoire
-
 Croatia
-
 Cuba
-
 Cyprus
-
 Czechia
-
 DR Congo
-
 Denmark
-
 Dominican Republic
-
 Ecuador
-
 Egypt
-
 El Salvador
-
 Estonia
-
 Eswatini
-
 Ethiopia
-
 Finland
-
 France
-
 Georgia
-
 Germany
-
 Ghana
-
 Greece
-
 Haiti
-
 Hong Kong
-
 Hungary
-
 India
-
 Indonesia
-
 Iran, Islamic republic
-
 Iraq
-
 Ireland
-
 Israel
-
 Italy
-
 Jamaica
-
 Japan
-
 Jordan
-
 Kazakhstan
-
 Kenya
-
 Korea
-
 Kuwait
-
 Kyrgyzstan
-
 Laos
-
 Latvia
-
 Lebanon
-
 Lesotho
-
 Libya
-
 Lithuania
-
 Luxembourg
-
 Madagascar
-
 Malaysia
-
 Malta
-
 Mauritius
-
 Mexico
-
 Moldova
-
 Mongolia
-
 Montenegro
-
 Morocco
-
 Mozambique
-
 Myanmar
-
 Namibia
-
 Nepal
-
 Netherlands
-
 New Zealand
-
 Nigeria
-
 North Macedonia
-
 Norway
-
 Oman
-
 Pakistan
-
 Palestine
-
 Panama
-
 Papua New Guinea
-
 Paraguay
-
 Peru
-
 Philippines
-
 Poland
-
 Portugal
-
 Puerto Rico
-
 Qatar
-
 Reunion
-
 Romania
-
 Rwanda
-
 Saudi Arabia
-
 Serbia
-
 Singapore
-
 Slovakia
-
 Slovenia
-
 Somalia
-
 South Africa
-
 Spain
-
 Sri Lanka
-
 Sweden
-
 Switzerland
-
 Syria
-
 Taiwan
-
 Tajikistan
-
 Tanzania
-
 Thailand
-
 Trinidad and Tobago
-
 Tunisia
-
 Turkey
-
 UAE
-
 Uganda
-
 Ukraine
-
 United Kingdom
-
United States
-
 Uruguay
-
 Uzbekistan
-
 Venezuela
-
 Vietnam
-
 Yemen
-
 Zambia
-
 Zimbabwe
- Forex
- Crypto












