


Telefonaktiebolaget L M Ericsson ADR (ERIC) surged 3.29% after news that its upgraded cloud-native 5G Core network for VodafoneThree has gone live in the UK, highlighting a major corporate milestone. The rally finds some support from Ericsson now trading above its 20-day and 50-day moving averages, even as lingering longer-term pressure is signaled by its position below the 200-day average.
 11.15
11.15
Highlights
- Ericsson and VodafoneThree deployed a SEK 12.5 billion cloud-native 5G Core network in the UK, enabling new enterprise and consumer connectivity services.
- Ericsson is providing dedicated core and radio technology for the upgraded UK network and completed its 2026 Annual General Meeting on March 31, 2026.
- Shares of Ericsson are trading higher near session highs, but mixed momentum signals and a forecast range of $9.86 to $10.55 indicate a likely sideways or downward move in the next 5 days.
Connectivity expansion as Ericsson secures major VodafoneThree contract
Ericsson and VodafoneThree marked a significant milestone with the launch of their upgraded SEK 12.5 billion, eight-year cloud-native 5G Core network in the UK, with Ericsson providing the dedicated core and radio technology. This move enables new advanced connectivity services for both consumers and enterprises, including Vodafone SuperMobile and network slicing. Ericsson also completed its 2026 Annual General Meeting on March 31, 2026.
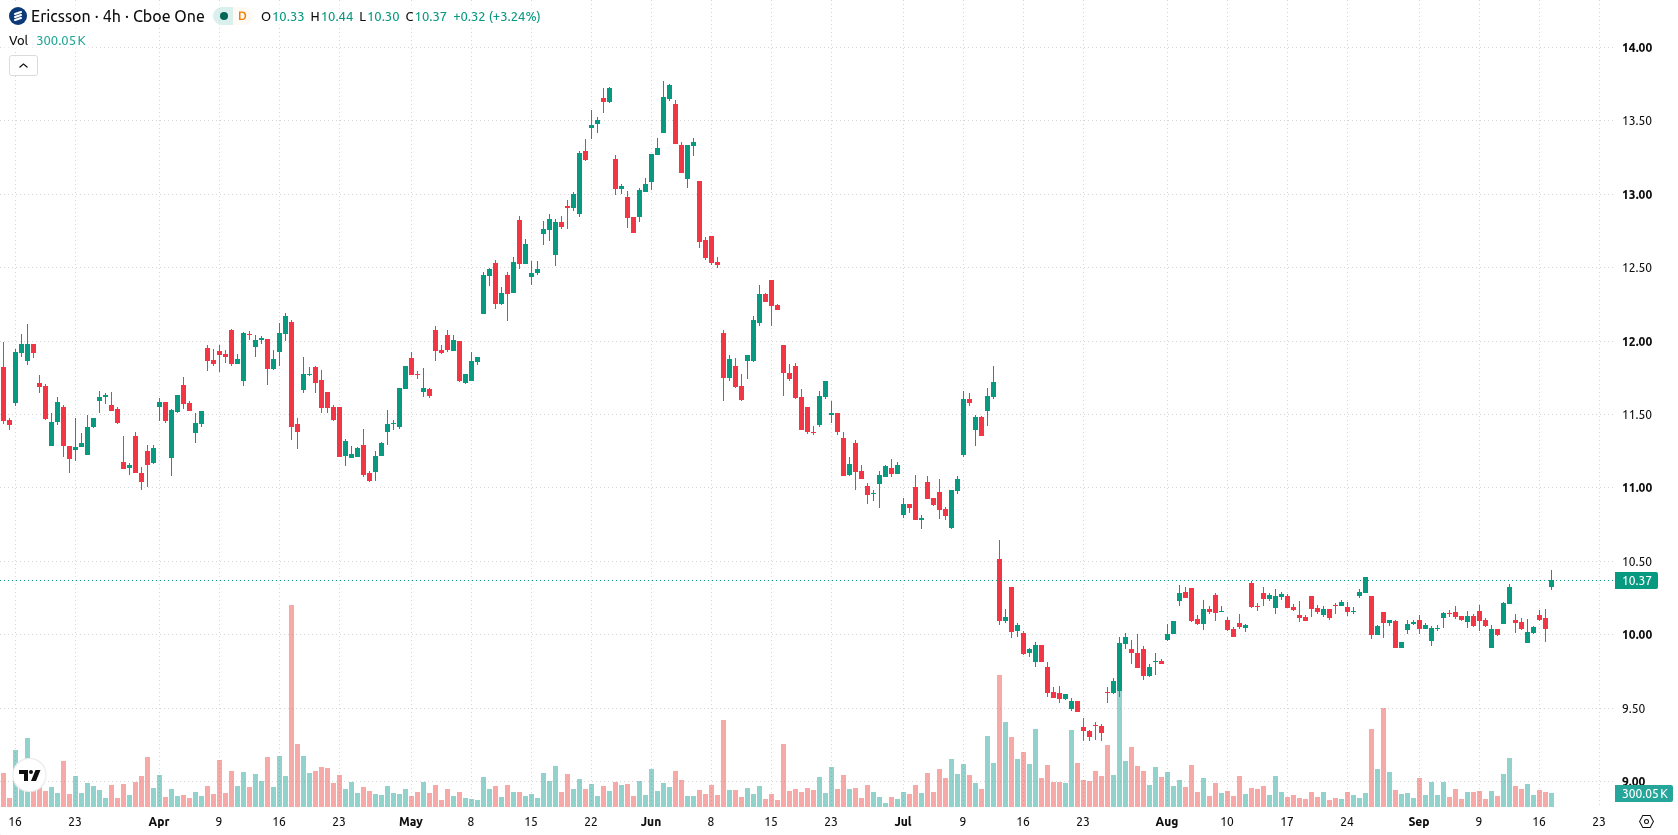
Short-term strength contrasts with mixed momentum signals
Ericsson is trading above both its 20-day and 50-day moving averages at $10.10 and $10.12, but remains under the 200-day at $10.89, suggesting near-term and medium-term buying interest while longer-term pressure persists. Immediate resistance is at $10.55, with support seen at $10.32. The 200-day average sits above as a longer-term trend confirmation, and the Ichimoku Kijun at $10.14 acts as short-term support. Momentum signals are mixed: Moving Average Convergence Divergence (MACD) and Awesome Oscillator (AO) both point lower, indicating negative momentum. The Relative Strength Index (RSI) at 46.61 and Commodity Channel Index (CCI) at -50.89 reflect mild downside pressure, neither oversold nor overbought. The Average Directional Index (ADX) and Stochastic RSI both indicate neutrality. Bull/Bear Power (BBP) is slightly positive at 0.1, showing buyers have a marginal edge intraday. Ericsson is up $0.33 or 3.29% so far today. There was an upside gap of $0.11 (1.1%) at the open, and the stock is now trading near session highs with intraday volatility at 2.11%. Momentum indicators lean bearish but price action and BBP show pockets of intraday strength, highlighting a divergence between trend and short-term activity.
Earlier, analysts noted that Ericsson remained under sustained bearish pressure, as persistent downside momentum and technical weakness dominated trading action. The current move above short- and medium-term moving averages introduces the prospect of developing support, but traders should monitor whether Ericsson can sustain this shift in trend or if risk remains for a retest of the lower end of the anticipated volatility band.






Latest Telefonaktiebolaget L M Ericsson ADR News


-
 Afghanistan
-
 Albania
-
 Algeria
-
 Angola
-
 Argentina
-
 Armenia
-
 Australia
-
 Austria
-
 Azerbaijan
-
 Bahamas
-
 Bahrain
-
 Bangladesh
-
 Belarus
-
 Belgium
-
 Bolivia
-
 Botswana
-
 Brazil
-
 Brunei
-
 Bulgaria
-
 Cambodia
-
 Cameroon
-
 Canada
-
 Chile
-
 China
-
 Colombia
-
 Congo
-
 Costa Rica
-
 Cote d'Ivoire
-
 Croatia
-
 Cuba
-
 Cyprus
-
 Czechia
-
 DR Congo
-
 Denmark
-
 Dominican Republic
-
 Ecuador
-
 Egypt
-
 El Salvador
-
 Estonia
-
 Eswatini
-
 Ethiopia
-
 Finland
-
 France
-
 Georgia
-
 Germany
-
 Ghana
-
 Greece
-
 Haiti
-
 Hong Kong
-
 Hungary
-
 India
-
 Indonesia
-
 Iran, Islamic republic
-
 Iraq
-
 Ireland
-
 Israel
-
 Italy
-
 Jamaica
-
 Japan
-
 Jordan
-
 Kazakhstan
-
 Kenya
-
 Korea
-
 Kuwait
-
 Kyrgyzstan
-
 Laos
-
 Latvia
-
 Lebanon
-
 Lesotho
-
 Libya
-
 Lithuania
-
 Luxembourg
-
 Madagascar
-
 Malaysia
-
 Malta
-
 Mauritius
-
 Mexico
-
 Moldova
-
 Mongolia
-
 Montenegro
-
 Morocco
-
 Mozambique
-
 Myanmar
-
 Namibia
-
 Nepal
-
 Netherlands
-
 New Zealand
-
 Nigeria
-
 North Macedonia
-
 Norway
-
 Oman
-
 Pakistan
-
 Palestine
-
 Panama
-
 Papua New Guinea
-
 Paraguay
-
 Peru
-
 Philippines
-
 Poland
-
 Portugal
-
 Puerto Rico
-
 Qatar
-
 Reunion
-
 Romania
-
 Rwanda
-
 Saudi Arabia
-
 Serbia
-
 Singapore
-
 Slovakia
-
 Slovenia
-
 Somalia
-
 South Africa
-
 Spain
-
 Sri Lanka
-
 Sweden
-
 Switzerland
-
 Syria
-
 Taiwan
-
 Tajikistan
-
 Tanzania
-
 Thailand
-
 Trinidad and Tobago
-
 Tunisia
-
 Turkey
-
 UAE
-
 Uganda
-
 Ukraine
-
 United Kingdom
-
United States
-
 Uruguay
-
 Uzbekistan
-
 Venezuela
-
 Vietnam
-
 Yemen
-
 Zambia
-
 Zimbabwe
- Forex
- Crypto












