


Rivian Automotive, Inc. (RIVN) extended lower by 3.23% after delivering its first R2 electric crossovers with the new Coastal Cloud Signature interior and confirming a significantly reduced production cost structure. The downward move is reinforced by the current technical setup, with recent selling pressure outweighing otherwise constructive developments.
 13.95
14.82
13.95
14.82
Highlights
- Rivian delivered its first R2 electric crossovers with a redesigned interior and nearly 50% lower bill of materials than the R1 generation.
- Strong growth in sales and production, new high-performance models, and Autonomy+ test results have been announced, but shares remain under selling pressure.
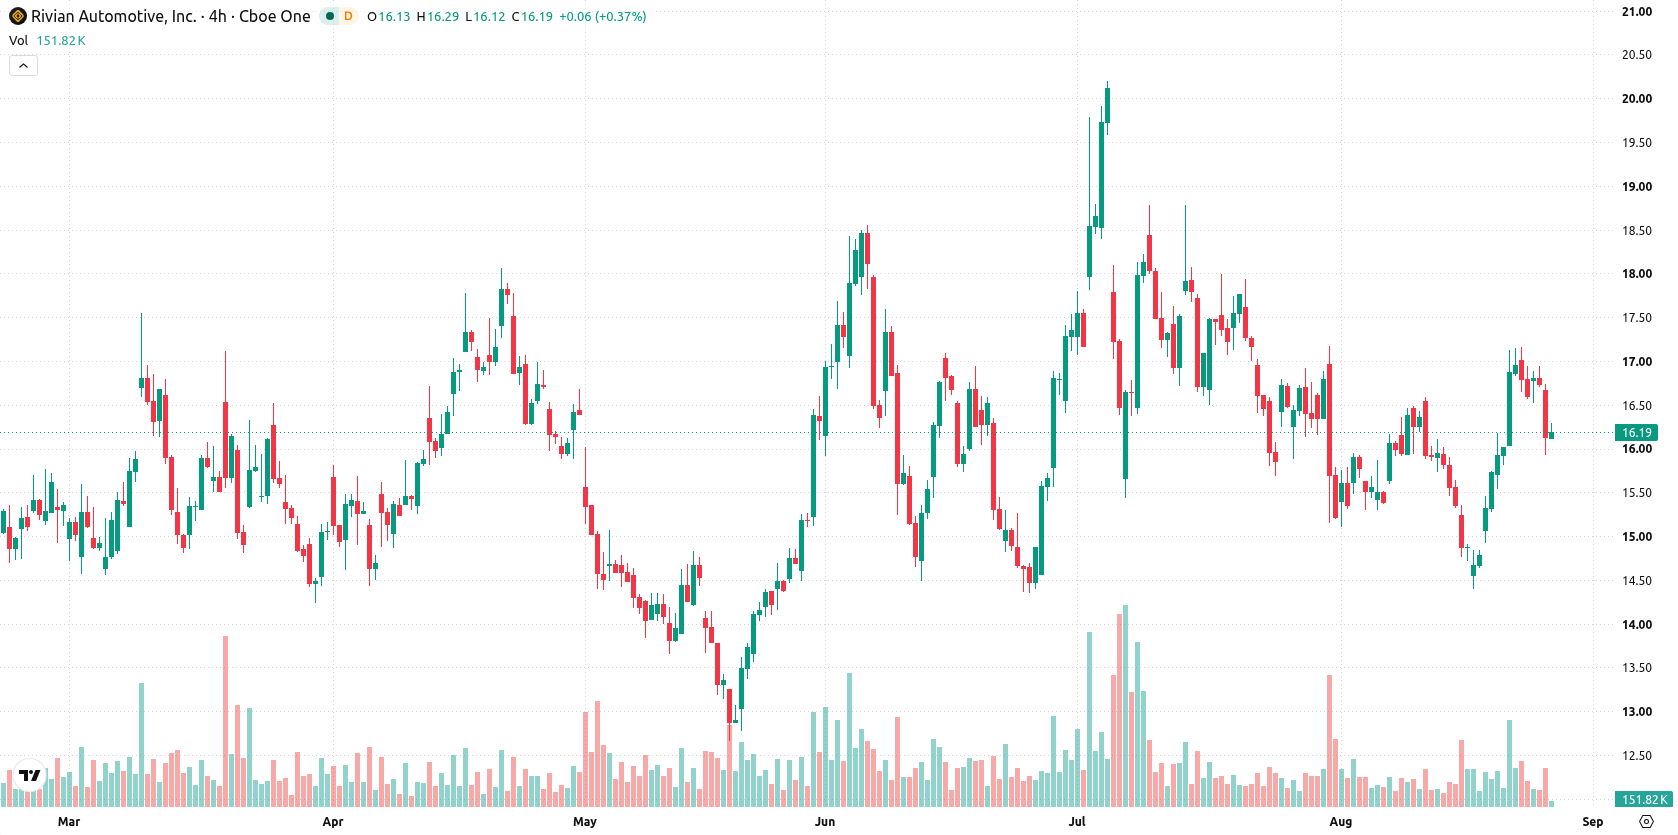
- Shares of Rivian trade near $16.2 with near-term support at $15.9 and resistance at $16.29, as overbought signals clash with bearish momentum and uncertainty dominates the outlook in the $15.39 to $17.01 range.
Momentum stalls despite R2 launch and upbeat operational announcements
Rivian delivered its first R2 electric crossovers featuring the updated Coastal Cloud Signature interior following the recent launch of this option. The R2’s introduction included a redesigned cost structure, reducing the bill of materials by nearly 50% compared to the R1 generation. Recent company updates have highlighted sharp growth in sales and quarterly production, the creation of the Adventure Department to develop high-performance models, and new test results for the Autonomy+ hands-free system, though price action has remained under broader selling pressure.
Mixed technical signals as short-term support holds amid long-term pressure
Rivian is trading above its 20-day moving average at $15.9 but remains below both the 50-day at $16.44 and the 200-day at $16.29, indicating short-term support but ongoing medium- and long-term pressure from sellers. The near-term ceiling is at $16.29 and support stands at $15.9, with the Ichimoku Kijun at $16.2 acting as additional support. The longer-term trend structure is still technically bullish. Momentum signals are mixed: the MACD points to strong bearish momentum, while the Average Directional Index (ADX) is neutral and lacks a clear trend. Overbought conditions are signaled by the Stochastic RSI, Commodity Channel Index (CCI), and Bull/Bear Power (BBP); the latter confirms that buyers dominate intraday momentum, but its overbought reading raises caution. The Relative Strength Index (RSI) sits in neutral-bullish territory at 53.78 and forecasts a buy. The Awesome Oscillator is currently neutral. Rivian traded lower today, currently priced at $16.2, near the low of its $16.51–$16.94 intraday range, with daily volatility at 2.60%. The tone leans toward pressure after the open, and the divergence between overbought signals and negative momentum suggests rising uncertainty in the very near term.
Earlier, analysts noted that Rivian shares were facing persistent technical weakness and mixed momentum signals, warranting close monitoring for downside risks. The latest analysis introduces heightened uncertainty as overbought intraday readings now conflict with bearish momentum, setting up a pivotal test of support at $15.9 in the days ahead.





Latest Rivian Automotive News





-
 Afghanistan
-
 Albania
-
 Algeria
-
 Angola
-
 Argentina
-
 Armenia
-
 Australia
-
 Austria
-
 Azerbaijan
-
 Bahamas
-
 Bahrain
-
 Bangladesh
-
 Belarus
-
 Belgium
-
 Bolivia
-
 Botswana
-
 Brazil
-
 Brunei
-
 Bulgaria
-
 Cambodia
-
 Cameroon
-
 Canada
-
 Chile
Chile
-
 China
China
-
 Colombia
-
 Congo
Congo
-
 Costa Rica
-
 Cote d'Ivoire
-
 Croatia
-
 Cuba
Cuba
-
 Cyprus
-
 Czechia
-
 DR Congo
-
 Denmark
-
 Dominican Republic
-
 Ecuador
-
 Egypt
Egypt
-
 El Salvador
-
 Estonia
-
 Eswatini
-
 Ethiopia
-
 Finland
-
 France
-
 Georgia
-
 Germany
-
 Ghana
Ghana
-
 Greece
-
 Haiti
Haiti
-
 Hong Kong
-
 Hungary
-
 India
India
-
 Indonesia
-
 Iran, Islamic republic
-
 Iraq
Iraq
-
 Ireland
-
 Israel
-
 Italy
Italy
-
 Jamaica
-
 Japan
Japan
-
 Jordan
-
 Kazakhstan
-
 Kenya
Kenya
-
 Korea
Korea
-
 Kuwait
-
 Kyrgyzstan
-
 Laos
Laos
-
 Latvia
-
 Lebanon
-
 Lesotho
-
 Libya
Libya
-
 Lithuania
-
 Luxembourg
-
 Madagascar
-
 Malaysia
-
 Malta
Malta
-
 Mauritius
-
 Mexico
-
 Moldova
-
 Mongolia
-
 Montenegro
-
 Morocco
-
 Mozambique
-
 Myanmar
-
 Namibia
-
 Nepal
Nepal
-
 Netherlands
-
 New Zealand
-
 Nigeria
-
 North Macedonia
-
 Norway
-
 Oman
Oman
-
 Pakistan
-
 Palestine
-
 Panama
-
 Papua New Guinea
-
 Paraguay
-
 Peru
Peru
-
 Philippines
-
 Poland
-
 Portugal
-
 Puerto Rico
-
 Qatar
Qatar
-
 Reunion
-
 Romania
-
 Rwanda
-
 Saudi Arabia
-
 Serbia
-
 Singapore
-
 Slovakia
-
 Slovenia
-
 Somalia
-
 South Africa
-
 Spain
Spain
-
 Sri Lanka
-
 Sweden
-
 Switzerland
-
 Syria
Syria
-
 Taiwan
-
 Tajikistan
-
 Tanzania
-
 Thailand
-
 Trinidad and Tobago
-
 Tunisia
-
 Turkey
-
 UAE
UAE
-
 Uganda
-
 Ukraine
-
 United Kingdom
-
United States
-
 Uruguay
-
 Uzbekistan
-
 Venezuela
-
 Vietnam
-
 Yemen
Yemen
-
 Zambia
-
 Zimbabwe
- Forex
- Crypto












