

SoFi shares technical analysis: Selloff intensifies near $17.78 support

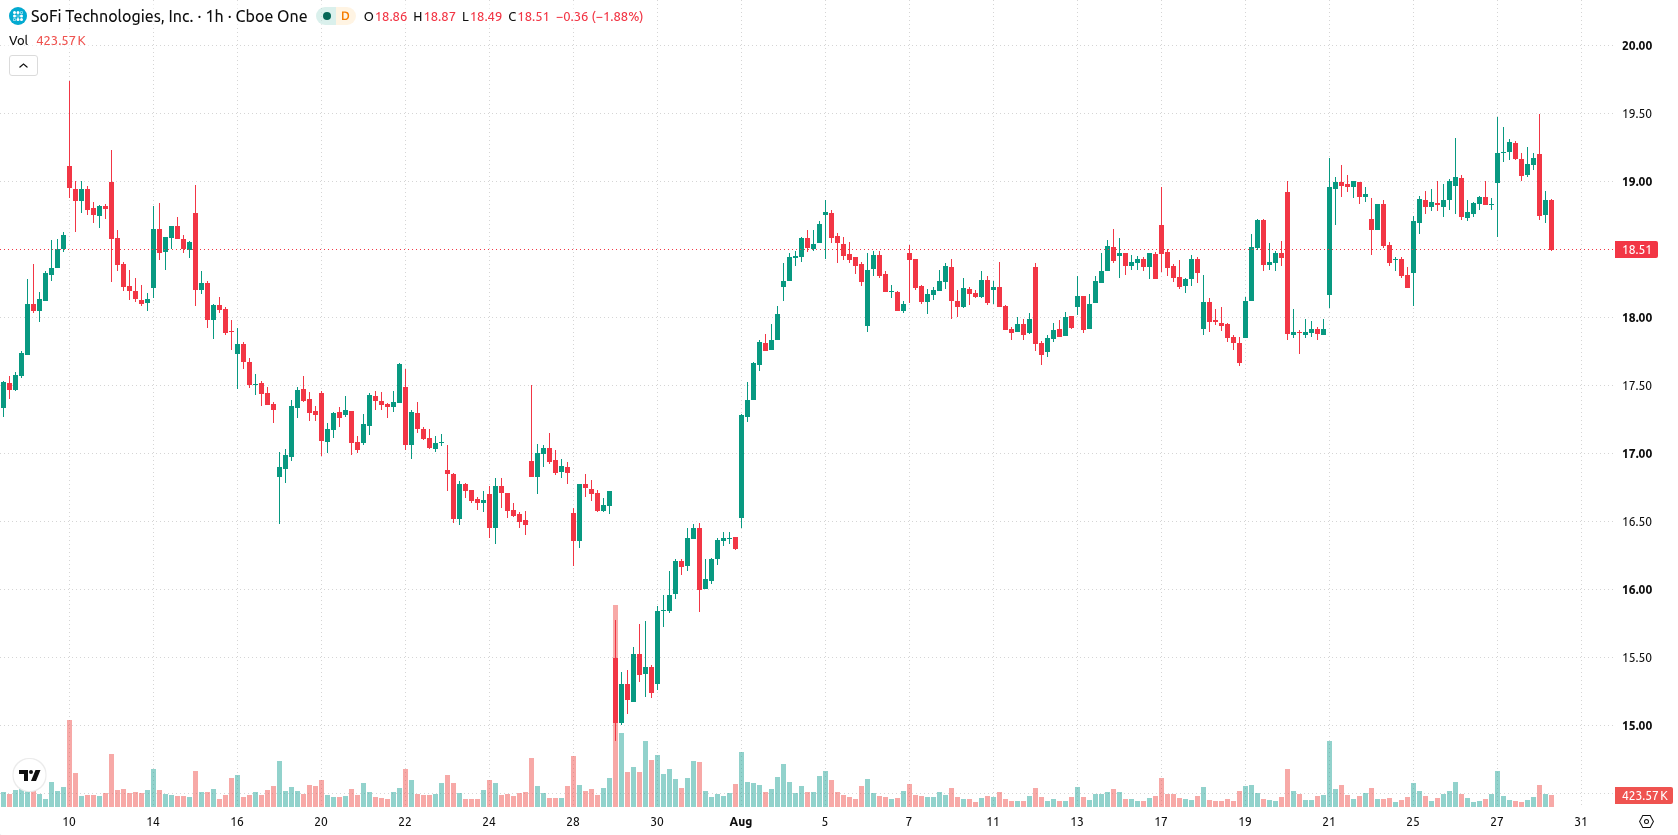
SoFi (SOFI) stock is trading at $18.34, down 4.38% for the day and closing near the session's low. The price remains below its key moving averages, reflecting continued downward momentum.
 16.97
17.63
Highlights
- SoFi Technologies reported record second-quarter revenue of $1.22 billion, up 43% year-over-year, with adjusted EPS at 12 cents.
- Management raised full-year 2026 revenue guidance to $4.75 billion to $4.85 billion after adding 1.1 million new members for a total of 15.8 million.
- Shares of SoFi Technologies fell 4.38% to $18.34, remaining below key moving averages within a $17.78 to $18.9 projected trading range, with technical signals split between oversold conditions and sustained downside.
Revenue surge and upbeat guidance contrast with persistent selling pressure
SoFi Technologies reported record revenue of $1.22 billion for the second quarter of 2026, a 43% increase year-over-year, with adjusted EPS reaching 12 cents, according to Benzinga. The company also added 1.1 million new members during the quarter, bringing total membership to 15.8 million and expanding its future revenue base. Management raised its full-year 2026 revenue guidance to a range of $4.75 billion to $4.85 billion, reflecting confidence in its business momentum, though price action has remained under broader selling pressure.
Mixed momentum and oversold signals as key resistance caps rebounds
On the hourly chart, SOFI is trading below the MA-20 and MA-50, while the daily timeframe shows price extending beneath the MA-200. The Ichimoku Kijun at $18.77 acts as immediate resistance for any rebounds, with next support seen near $17.78. Momentum indicators are mixed: MACD presents strong buy momentum, ADX remains neutral, and RSI maintains a sell bias. Both Stochastic RSI and CCI flag oversold conditions, hinting at near-term rebound risk. Bull/Bear Power signals sellers remain dominant intraday, while the Awesome Oscillator is neutral, leaving directional commitment unresolved.
Sideways price bias outlined as breakout levels define risk
Looking ahead to the next few sessions, SOFI is projected to trade within a volatility band of $17.78 to $18.9. The probability of an upward move stands at 48%, while a downward move is marginally more likely at 52%. The baseline scenario expects sideways movement within this corridor. A breakout above immediate resistance at $18.77 could trigger a bullish reversal, while a decline below $17.78 would open the path for further downside extension.
Earlier, analysts noted that SoFi’s technical setup was marked by short-term strength amid heightened institutional activity and rising volatility, though longer-term uncertainties lingered. The latest developments introduce a new phase of downside momentum despite improving fundamentals, making $18.77 a critical resistance level to watch for signals of a potential reversal.










-
 Afghanistan
-
 Albania
-
 Algeria
-
 Angola
-
 Argentina
-
 Armenia
-
 Australia
-
 Austria
-
 Azerbaijan
-
 Bahamas
-
 Bahrain
-
 Bangladesh
-
 Belarus
-
 Belgium
-
 Bolivia
-
 Botswana
-
 Brazil
-
 Brunei
-
 Bulgaria
-
 Cambodia
-
 Cameroon
-
 Canada
-
 Chile
-
 China
-
 Colombia
-
 Congo
-
 Costa Rica
-
 Cote d'Ivoire
-
 Croatia
-
 Cuba
-
 Cyprus
-
 Czechia
-
 DR Congo
-
 Denmark
-
 Dominican Republic
-
 Ecuador
-
 Egypt
-
 El Salvador
-
 Estonia
-
 Eswatini
-
 Ethiopia
-
 Finland
-
 France
-
 Georgia
-
 Germany
-
 Ghana
-
 Greece
-
 Haiti
-
 Hong Kong
-
 Hungary
-
 India
-
 Indonesia
-
 Iran, Islamic republic
-
 Iraq
-
 Ireland
-
 Israel
-
 Italy
-
 Jamaica
-
 Japan
-
 Jordan
-
 Kazakhstan
-
 Kenya
-
 Korea
-
 Kuwait
-
 Kyrgyzstan
-
 Laos
-
 Latvia
-
 Lebanon
-
 Lesotho
-
 Libya
-
 Lithuania
-
 Luxembourg
-
 Madagascar
-
 Malaysia
-
 Malta
-
 Mauritius
-
 Mexico
-
 Moldova
-
 Mongolia
-
 Montenegro
-
 Morocco
-
 Mozambique
-
 Myanmar
-
 Namibia
-
 Nepal
-
 Netherlands
-
 New Zealand
-
 Nigeria
-
 North Macedonia
-
 Norway
-
 Oman
-
 Pakistan
-
 Palestine
-
 Panama
-
 Papua New Guinea
-
 Paraguay
-
 Peru
-
 Philippines
-
 Poland
-
 Portugal
-
 Puerto Rico
-
 Qatar
-
 Reunion
-
 Romania
-
 Rwanda
-
 Saudi Arabia
-
 Serbia
-
 Singapore
-
 Slovakia
-
 Slovenia
-
 Somalia
-
 South Africa
-
 Spain
-
 Sri Lanka
-
 Sweden
-
 Switzerland
-
 Syria
-
 Taiwan
-
 Tajikistan
-
 Tanzania
-
 Thailand
-
 Trinidad and Tobago
-
 Tunisia
-
 Turkey
-
 UAE
-
 Uganda
-
 Ukraine
-
 United Kingdom
-
United States
-
 Uruguay
-
 Uzbekistan
-
 Venezuela
-
 Vietnam
-
 Yemen
-
 Zambia
-
 Zimbabwe
- Forex
- Crypto












