

GameStop stock rises nearly 4% as Q2 preview shows net income doubling on equity gains

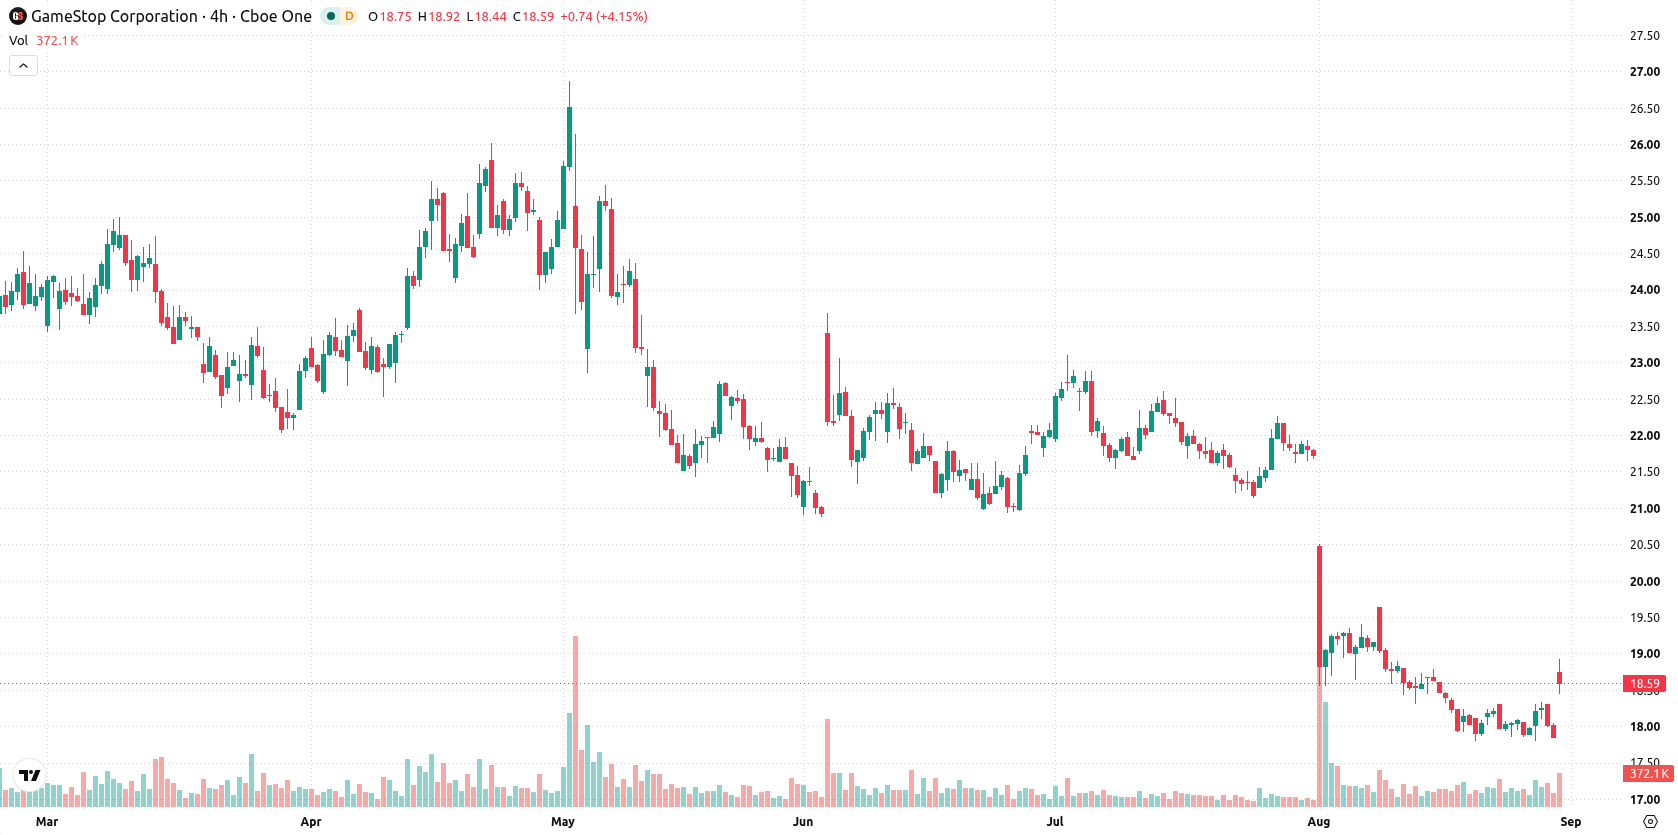
GameStop Corp. (GME) climbed 3.92% after preliminary Q2 2026 results showed net income set to double, largely due to equity gains from derivative conversions and an amended convertible notes deal that reduced dilution risk. The rebound looks limited, with the stock still trading below both its 50-day and 200-day moving averages.
 27.53
27.53
27.53
27.53
Highlights
- GameStop projects second-quarter 2026 net income of $290 million to $310 million, primarily from a $238 million equity gain in eBay shares.
- Core net sales are expected at $780 million to $800 million, below last year’s $972 million, with cash and securities estimated at $5.05 billion to $5.07 billion.
- Shares of GameStop face persistent selling pressure, with a very high probability of trading between $18.31 and $18.84 over the next five sessions.
Equity conversion boosts income outlook as core sales decline
GameStop released preliminary results for Q2 2026, projecting net income of $290 million to $310 million, about double the prior-year period, mainly driven by converting derivative holdings into a 43.4 million share equity stake in eBay that generated roughly $238 million in gains. Core net sales are expected to decline to $780–$800 million from $972 million a year ago. The company also fixed the total share count at approximately 55.5 million and added a $358 million cash payment in its amended notes exchange, reducing dilution concerns. GameStop estimates end-of-quarter cash, equivalents, and marketable securities at $5.05 to $5.07 billion and will release full Q2 results on September 8.
Short-term stabilization as momentum indicators flag persistent pressure
GameStop is trading above its 20-day moving average (MA-20) at $18.49, but remains below both the 50-day (MA-50) at $20.5 and the 200-day (MA-200) at $22.23. This setup indicates short-term stabilization, while medium- and long-term pressure persists due to a bearish alignment between MA-50 and MA-200. Resistance is close at $18.68, matching today's high, and support is seen at $18.49 (MA-20). Daily momentum indicators, including MACD and ADX, point to further selling, and the RSI at 30.83 highlights oversold conditions. Stochastic RSI, CCI, and negative BBP confirm that sellers are currently dominating the tone.
Earlier, analysts noted that GameStop’s strengthened capital structure and equity gains had improved its financial flexibility, though key resistance remained an obstacle to further upside. The latest data reinforce ongoing rangebound trading with heightened downside risk, making $18.31 a crucial level for monitoring any potential breakdown in the days ahead.





Latest GameStop News






-
 Afghanistan
-
 Albania
-
 Algeria
-
 Angola
-
 Argentina
-
 Armenia
-
 Australia
-
 Austria
-
 Azerbaijan
-
 Bahamas
-
 Bahrain
-
 Bangladesh
-
 Belarus
-
 Belgium
-
 Bolivia
-
 Botswana
-
 Brazil
-
 Brunei
-
 Bulgaria
-
 Cambodia
-
 Cameroon
-
 Canada
-
 Chile
Chile
-
 China
China
-
 Colombia
-
 Congo
Congo
-
 Costa Rica
-
 Cote d'Ivoire
-
 Croatia
-
 Cuba
Cuba
-
 Cyprus
-
 Czechia
-
 DR Congo
-
 Denmark
-
 Dominican Republic
-
 Ecuador
-
 Egypt
Egypt
-
 El Salvador
-
 Estonia
-
 Eswatini
-
 Ethiopia
-
 Finland
-
 France
-
 Georgia
-
 Germany
-
 Ghana
Ghana
-
 Greece
-
 Haiti
Haiti
-
 Hong Kong
-
 Hungary
-
 India
India
-
 Indonesia
-
 Iran, Islamic republic
-
 Iraq
Iraq
-
 Ireland
-
 Israel
-
 Italy
Italy
-
 Jamaica
-
 Japan
Japan
-
 Jordan
-
 Kazakhstan
-
 Kenya
Kenya
-
 Korea
Korea
-
 Kuwait
-
 Kyrgyzstan
-
 Laos
Laos
-
 Latvia
-
 Lebanon
-
 Lesotho
-
 Libya
Libya
-
 Lithuania
-
 Luxembourg
-
 Madagascar
-
 Malaysia
-
 Malta
Malta
-
 Mauritius
-
 Mexico
-
 Moldova
-
 Mongolia
-
 Montenegro
-
 Morocco
-
 Mozambique
-
 Myanmar
-
 Namibia
-
 Nepal
Nepal
-
 Netherlands
-
 New Zealand
-
 Nigeria
-
 North Macedonia
-
 Norway
-
 Oman
Oman
-
 Pakistan
-
 Palestine
-
 Panama
-
 Papua New Guinea
-
 Paraguay
-
 Peru
Peru
-
 Philippines
-
 Poland
-
 Portugal
-
 Puerto Rico
-
 Qatar
Qatar
-
 Reunion
-
 Romania
-
 Rwanda
-
 Saudi Arabia
-
 Serbia
-
 Singapore
-
 Slovakia
-
 Slovenia
-
 Somalia
-
 South Africa
-
 Spain
Spain
-
 Sri Lanka
-
 Sweden
-
 Switzerland
-
 Syria
Syria
-
 Taiwan
-
 Tajikistan
-
 Tanzania
-
 Thailand
-
 Trinidad and Tobago
-
 Tunisia
-
 Turkey
-
 UAE
UAE
-
 Uganda
-
 Ukraine
-
 United Kingdom
-
United States
-
 Uruguay
-
 Uzbekistan
-
 Venezuela
-
 Vietnam
-
 Yemen
Yemen
-
 Zambia
-
 Zimbabwe
- Forex
- Crypto












