

Intuit shares approach key resistance at $365.77 as buyers hold control: weekly analysis

Shares of Intuit Inc. (INTU) are trading near $359 as a recent rally runs into overbought conditions. Despite mixed momentum signals and volatility staying elevated, buyers are keeping the upper hand while the stock consolidates at the top of its range. The week ahead hinges on whether technical and news-driven pressures trigger a breakout or continued consolidation.
 341.50
351.39
Highlights
- Shares of Intuit edged higher to $359.24 over the past week, holding above short-term moving averages.
- The stock remains in a long-term bearish pattern, trading well below its 200-day moving average.
- Intuit stock is expected to consolidate between $346.17 and $365.77, with buyers favored above key support.
Shifting sentiment this week as upbeat revenue clashes with cautious outlook
Intuit reported fourth quarter revenue of $4.354 billion, exceeding forecasts, and achieved record annual revenue of $21.4 billion for fiscal 2026, according to Fortune. However, lower-than-expected guidance for fiscal 2027, new strategies to attract customers by lowering TurboTax revenue per user, ongoing investments in AI and customer acquisition, and a partnership with AI startup Perplexity have contributed to shifting sentiment this week. The company also faces ongoing securities class action lawsuits alleging it misled investors about generative AI impacts, according to PR Newswire.
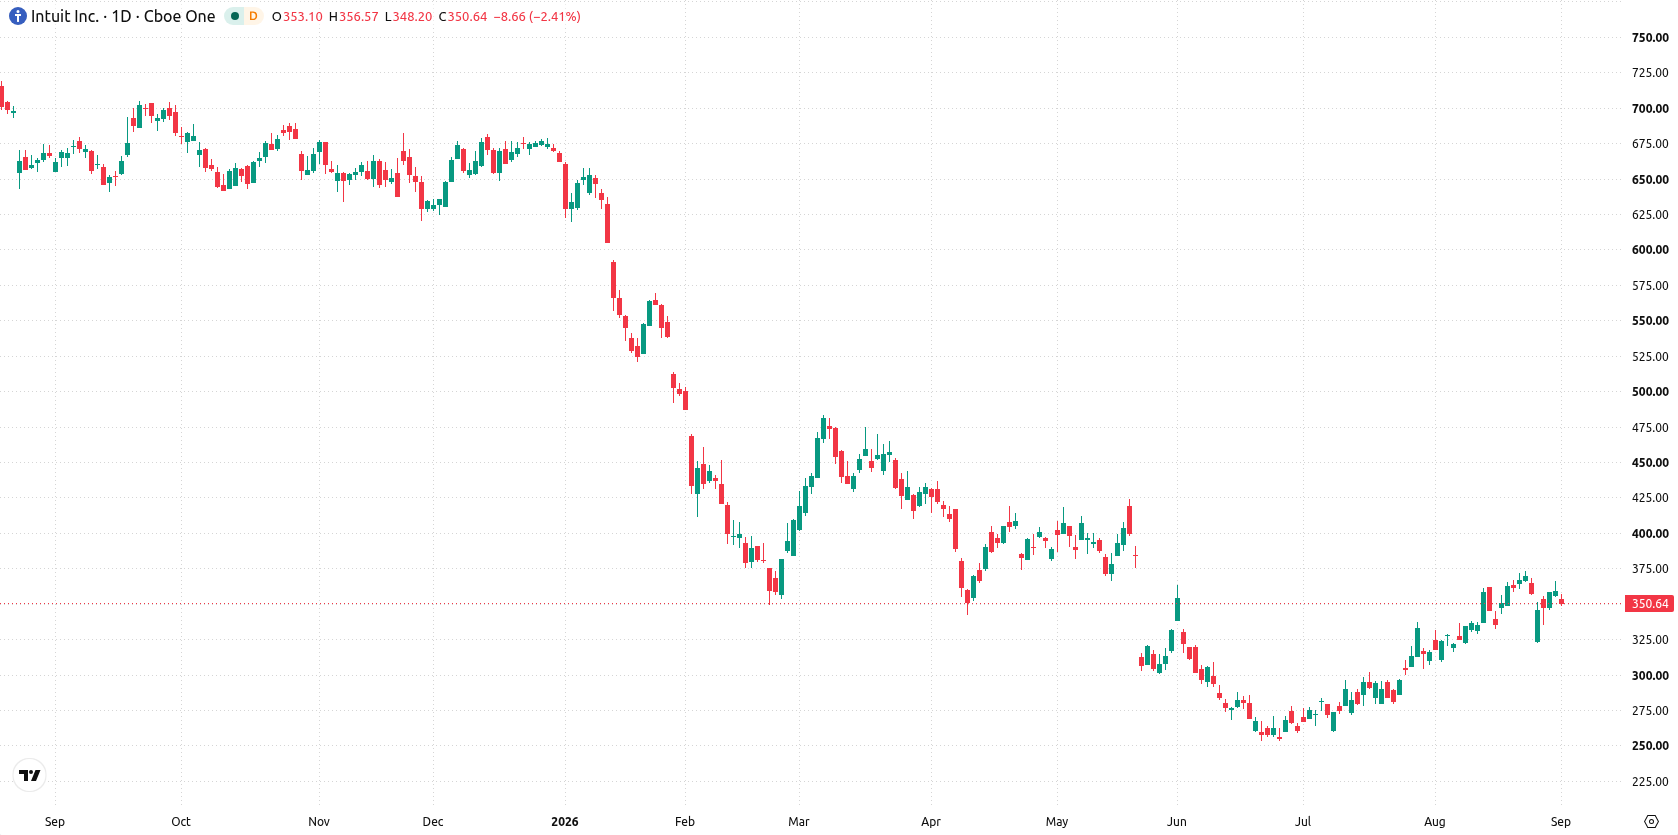
Technical signals mixed over the week as consolidation persists near resistance
On the daily chart, the lack of a clear directional trend is reflected in a flat trend strength and recent price action showing a sharp move higher without a sustained trend. Momentum signals are mixed, with MACD in strong buy territory at 15.13 while RSI at 60.51 approaches overbought levels, and volatility remains elevated at 9.09%. Immediate support is seen around $346.17, backed by the Ichimoku Kijun at $335.92, while resistance is marked at the recent high of $365.77. The overall daily structure points toward continued consolidation near the upper end of the recent range, with buyers retaining a technical advantage above support.
Upside breakout risk next week as consolidation tests resistance levels
In the week ahead, the expected range is $345.6 to $372.87, with a very high probability of an increase and a very low probability of a decrease. The base case sees the stock consolidating between $346.17 support and $365.77 resistance. A close above $365.77 would open up the upper end of the expected range, while a break below $346.17 puts the $335.92 Ichimoku Kijun into view as next support.
Earlier, analysts noted that Intuit stock remained technically vulnerable, with downside risks outweighing the probability of a sustained breakout. The current analysis adds new dimensions by highlighting elevated volatility, unresolved legal uncertainties, and the importance of monitoring the $365.77 resistance as a critical level for any short-term directional move.











-
 Afghanistan
-
 Albania
-
 Algeria
-
 Angola
-
 Argentina
-
 Armenia
-
 Australia
-
 Austria
-
 Azerbaijan
-
 Bahamas
-
 Bahrain
-
 Bangladesh
-
 Belarus
-
 Belgium
-
 Bolivia
-
 Botswana
-
 Brazil
-
 Brunei
-
 Bulgaria
-
 Cambodia
-
 Cameroon
-
 Canada
-
 Chile
-
 China
-
 Colombia
-
 Congo
-
 Costa Rica
-
 Cote d'Ivoire
-
 Croatia
-
 Cuba
-
 Cyprus
-
 Czechia
-
 DR Congo
-
 Denmark
-
 Dominican Republic
-
 Ecuador
-
 Egypt
-
 El Salvador
-
 Estonia
-
 Eswatini
-
 Ethiopia
-
 Finland
-
 France
-
 Georgia
-
 Germany
-
 Ghana
-
 Greece
-
 Haiti
-
 Hong Kong
-
 Hungary
-
 India
-
 Indonesia
-
 Iran, Islamic republic
-
 Iraq
-
 Ireland
-
 Israel
-
 Italy
-
 Jamaica
-
 Japan
-
 Jordan
-
 Kazakhstan
-
 Kenya
-
 Korea
-
 Kuwait
-
 Kyrgyzstan
-
 Laos
-
 Latvia
-
 Lebanon
-
 Lesotho
-
 Libya
-
 Lithuania
-
 Luxembourg
-
 Madagascar
-
 Malaysia
-
 Malta
-
 Mauritius
-
 Mexico
-
 Moldova
-
 Mongolia
-
 Montenegro
-
 Morocco
-
 Mozambique
-
 Myanmar
-
 Namibia
-
 Nepal
-
 Netherlands
-
 New Zealand
-
 Nigeria
-
 North Macedonia
-
 Norway
-
 Oman
-
 Pakistan
-
 Palestine
-
 Panama
-
 Papua New Guinea
-
 Paraguay
-
 Peru
-
 Philippines
-
 Poland
-
 Portugal
-
 Puerto Rico
-
 Qatar
-
 Reunion
-
 Romania
-
 Rwanda
-
 Saudi Arabia
-
 Serbia
-
 Singapore
-
 Slovakia
-
 Slovenia
-
 Somalia
-
 South Africa
-
 Spain
-
 Sri Lanka
-
 Sweden
-
 Switzerland
-
 Syria
-
 Taiwan
-
 Tajikistan
-
 Tanzania
-
 Thailand
-
 Trinidad and Tobago
-
 Tunisia
-
 Turkey
-
 UAE
-
 Uganda
-
 Ukraine
-
 United Kingdom
-
United States
-
 Uruguay
-
 Uzbekistan
-
 Venezuela
-
 Vietnam
-
 Yemen
-
 Zambia
-
 Zimbabwe
- Forex
- Crypto












