

Why are Texas Instruments shares down 3.6% today?

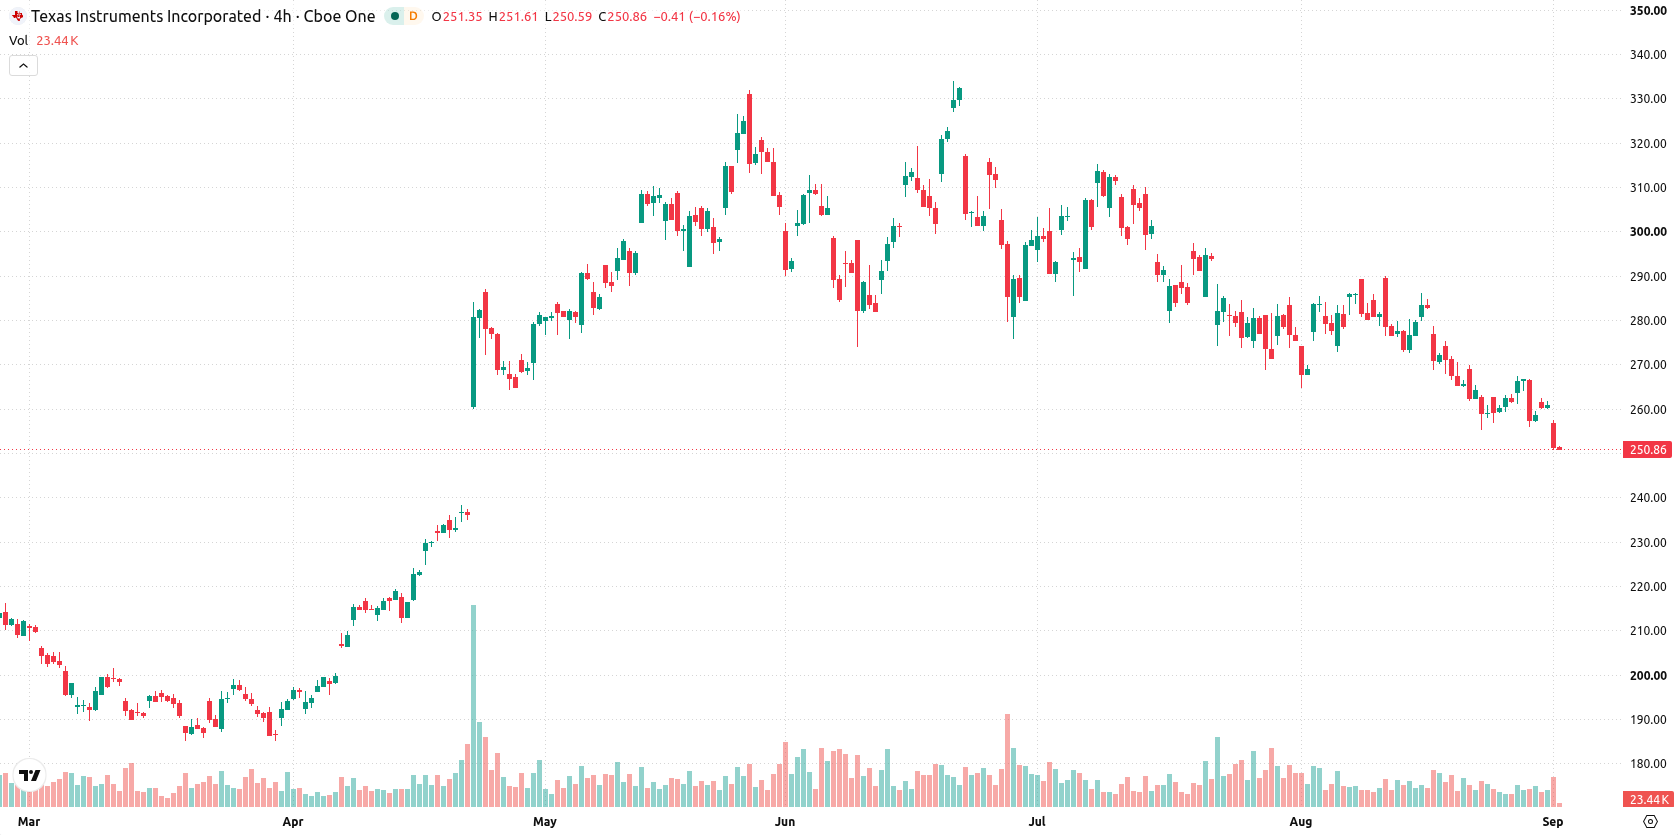
Texas Instruments Inc. (TXN) dropped 3.6% as sellers dominated after a session open gap, even as the company recently reported strong quarterly earnings and continued to attract institutional interest. The short- and medium-term trend is under pressure, with the stock trading below its 20-day and 50-day moving averages, which supports the downward tone.
 297.80
316.78
Highlights
- Texas Instruments delivered quarterly earnings per share of $2.14 and revenue of $5.46 billion, surpassing consensus estimates.
- The company maintains a net margin of 31.11% and a dividend yield of 3.39%, with Moore Capital Management LP acquiring 9,500 shares.
- Shares of Texas Instruments trade below short- and medium-term indicators, with technicals pointing to a 71% probability of a move to $245.66 or lower in the coming days.
Earnings beat and fresh fund inflow overshadowed by ongoing price pressure
Texas Instruments reported quarterly earnings per share of $2.14, beating consensus estimates and delivering $5.46 billion in revenue. The company was recognized for maintaining a dividend yield of approximately 3.39% and a net margin of 31.11%. Moore Capital Management LP acquired 9,500 shares in a recent transaction, though price action has remained under broader selling pressure.
Medium-term weakness and divergent momentum despite long-term support
Texas Instruments is trading below its 20-day and 50-day moving averages ($271.84 and $284.63), indicating ongoing short- and medium-term selling pressure, but it remains above the 200-day average ($237.47), reflecting support in the long-term structure. The closest resistance stands at $255.98, with immediate support at $245.66. The alignment between the 50-day and 200-day averages confirms a bullish longer-term trend. Momentum indicators are weak: MACD signals a sell, the ADX is neutral, and the RSI and CCI are in sell or near-oversold territory. Stochastic RSI signals a strong buy from oversold levels. Bull/Bear Power is negative, highlighting dominant intraday selling and an oversold state. The technical tone is soft, with the price near session lows and moderate intraday volatility. Divergence in oscillator signals hints at a potential near-term bounce.
Earlier, analysts noted that Texas Instruments was experiencing ongoing downside pressure, with the stock consolidating in a range amid technical uncertainty. This latest update strengthens that outlook, as persistent short- and medium-term weakness continues despite strong earnings, making the $245.66 support level a critical threshold for traders to monitor in the near term.






Latest Texas Instruments News




-
 Afghanistan
-
 Albania
-
 Algeria
-
 Angola
-
 Argentina
-
 Armenia
-
 Australia
-
 Austria
-
 Azerbaijan
-
 Bahamas
-
 Bahrain
-
 Bangladesh
-
 Belarus
-
 Belgium
-
 Bolivia
-
 Botswana
-
 Brazil
-
 Brunei
-
 Bulgaria
-
 Cambodia
-
 Cameroon
-
 Canada
-
 Chile
-
 China
-
 Colombia
-
 Congo
-
 Costa Rica
-
 Cote d'Ivoire
-
 Croatia
-
 Cuba
-
 Cyprus
-
 Czechia
-
 DR Congo
-
 Denmark
-
 Dominican Republic
-
 Ecuador
-
 Egypt
-
 El Salvador
-
 Estonia
-
 Eswatini
-
 Ethiopia
-
 Finland
-
 France
-
 Georgia
-
 Germany
-
 Ghana
-
 Greece
-
 Haiti
-
 Hong Kong
-
 Hungary
-
 India
-
 Indonesia
-
 Iran, Islamic republic
-
 Iraq
-
 Ireland
-
 Israel
-
 Italy
-
 Jamaica
-
 Japan
-
 Jordan
-
 Kazakhstan
-
 Kenya
-
 Korea
-
 Kuwait
-
 Kyrgyzstan
-
 Laos
-
 Latvia
-
 Lebanon
-
 Lesotho
-
 Libya
-
 Lithuania
-
 Luxembourg
-
 Madagascar
-
 Malaysia
-
 Malta
-
 Mauritius
-
 Mexico
-
 Moldova
-
 Mongolia
-
 Montenegro
-
 Morocco
-
 Mozambique
-
 Myanmar
-
 Namibia
-
 Nepal
-
 Netherlands
-
 New Zealand
-
 Nigeria
-
 North Macedonia
-
 Norway
-
 Oman
-
 Pakistan
-
 Palestine
-
 Panama
-
 Papua New Guinea
-
 Paraguay
-
 Peru
-
 Philippines
-
 Poland
-
 Portugal
-
 Puerto Rico
-
 Qatar
-
 Reunion
-
 Romania
-
 Rwanda
-
 Saudi Arabia
-
 Serbia
-
 Singapore
-
 Slovakia
-
 Slovenia
-
 Somalia
-
 South Africa
-
 Spain
-
 Sri Lanka
-
 Sweden
-
 Switzerland
-
 Syria
-
 Taiwan
-
 Tajikistan
-
 Tanzania
-
 Thailand
-
 Trinidad and Tobago
-
 Tunisia
-
 Turkey
-
 UAE
-
 Uganda
-
 Ukraine
-
 United Kingdom
-
United States
-
 Uruguay
-
 Uzbekistan
-
 Venezuela
-
 Vietnam
-
 Yemen
-
 Zambia
-
 Zimbabwe
- Forex
- Crypto












