

Hewlett Packard Enterprise shares drop about 3.5% after downside gap and mixed technical signals

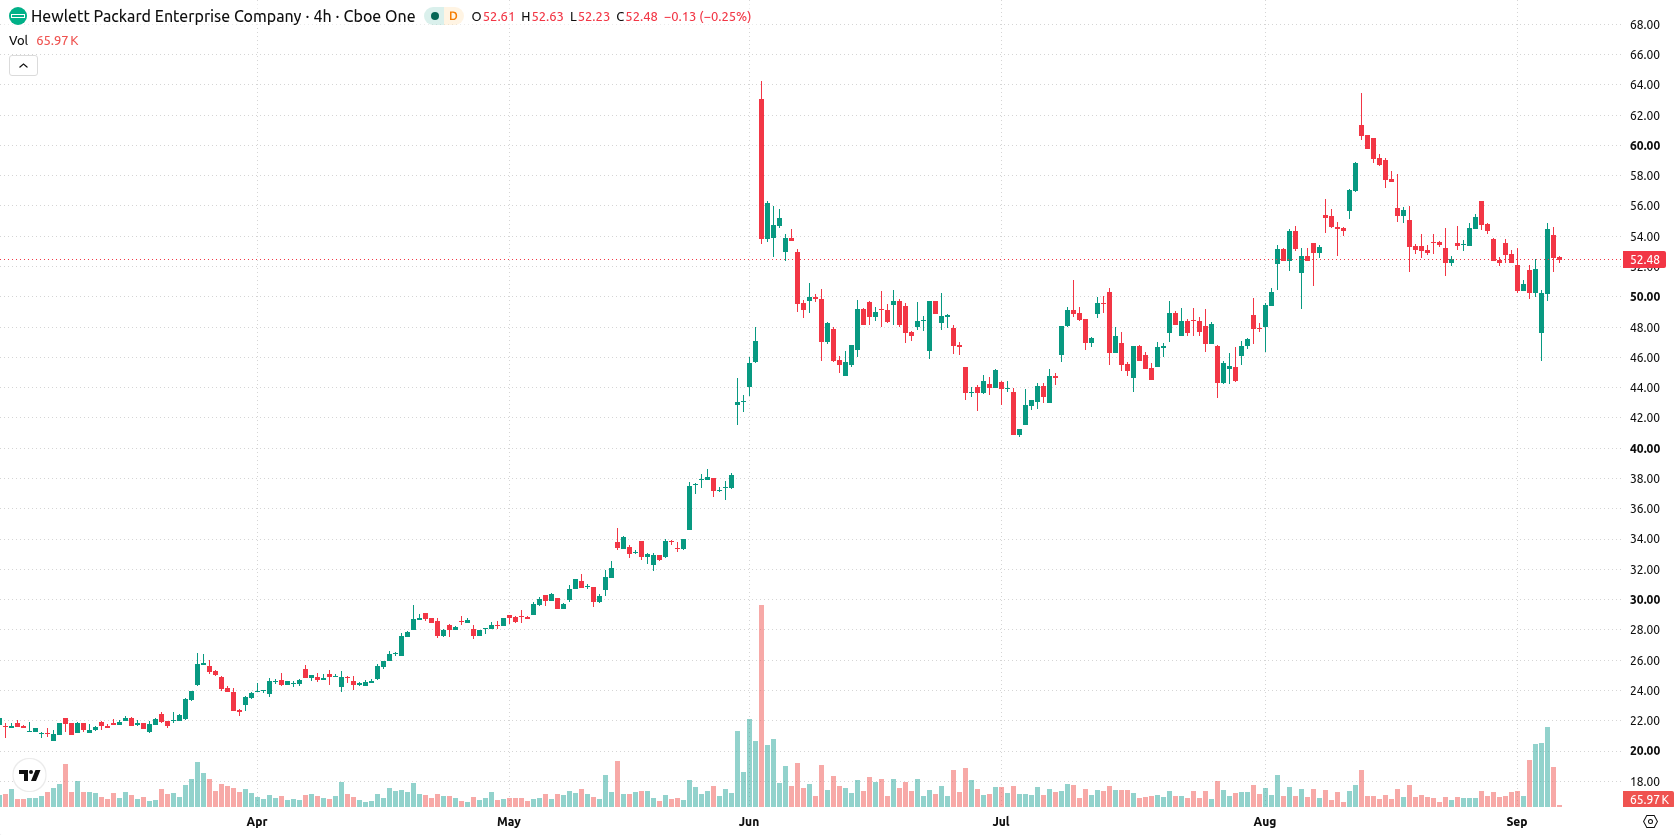
Hewlett Packard Enterprise Co (HPE) fell 3.58% after a downside gap, even as the company reported record fiscal Q3 results and raised its full-year outlook. The move is reinforced by near-term seller pressure, with the stock trading below its 20-day moving average and holding near today's intraday low.
 55.71
62.10
Highlights
- Hewlett Packard Enterprise posted fiscal Q3 2026 revenue of $12.2 billion, up 34% year over year, and EPS of $1.11, both above expectations.
- The company raised full-year revenue and earnings guidance for fiscal 2026 and 2027, announced an expanded partnership with Oracle, and continued share buybacks and dividends.
- Shares of Hewlett Packard Enterprise fell 3.58% to $52.49 with short-term seller pressure and expected consolidation between $47.9 to $57.08 over the next week.
Growth optimism tempered as selling persists amid robust demand
Hewlett Packard Enterprise reported record fiscal Q3 2026 results, with revenue up 34% year over year to $12.2 billion and EPS reaching $1.11, surpassing market expectations. Growth was attributed to strong demand for AI infrastructure, networking, and server solutions, and the company raised its full-year revenue and earnings guidance for fiscal 2026 and 2027. HPE also announced an expanded multi-year partnership with Oracle to deploy HPE Juniper networking in Oracle’s AI data centers and issued a quarterly dividend of $0.1425 per share, continuing share repurchases and debt reduction programs. Ongoing supply chain constraints for key components were noted, though price action has remained under broader selling pressure.
Mixed momentum signals as medium-term bull trend faces resistance
HPE is trading below its 20-day moving average at $54.48, but remains above both the 50-day moving average at $49.9 and the 200-day moving average at $33.1. This setup suggests near-term seller pressure, while the alignment of the 50-day above the 200-day MA signals a continued bullish structure for the medium and long term. The Ichimoku Kijun at $54.45 acts as the nearest resistance, with support found at today's intraday low of $51.61. Momentum indicators present a mixed backdrop: the MACD is in strong buy territory, the ADX is neutral, the RSI is moderately bullish at 55.44, the CCI has turned negative, and the Stochastic RSI is neutral. Bull/Bear Power shows buyers slightly dominant intraday, accompanied by a forecast of overbought conditions. However, the Awesome Oscillator issues a strong sell, diverging from some of the bullish technical signals. Price action is close to today's low and volatility amplitude stands at 5.87%, with persistent pressure after the open.
Earlier, analysts noted that despite HPE's outperformance in its previous quarterly report, ongoing supply constraints and broader market trends remained a focus for investors. The latest technical setup highlights $54.45 as a decisive resistance level for potential breakout, with downside risk increasing on a close below $51.61 in the coming sessions.






Latest Hewlett Packard Enterprise Co News




-
 Afghanistan
-
 Albania
-
 Algeria
-
 Angola
-
 Argentina
-
 Armenia
-
 Australia
-
 Austria
-
 Azerbaijan
-
 Bahamas
-
 Bahrain
-
 Bangladesh
-
 Belarus
-
 Belgium
-
 Bolivia
-
 Botswana
-
 Brazil
-
 Brunei
-
 Bulgaria
-
 Cambodia
-
 Cameroon
-
 Canada
-
 Chile
-
 China
-
 Colombia
-
 Congo
-
 Costa Rica
-
 Cote d'Ivoire
-
 Croatia
-
 Cuba
-
 Cyprus
-
 Czechia
-
 DR Congo
-
 Denmark
-
 Dominican Republic
-
 Ecuador
-
 Egypt
-
 El Salvador
-
 Estonia
-
 Eswatini
-
 Ethiopia
-
 Finland
-
 France
-
 Georgia
-
 Germany
-
 Ghana
-
 Greece
-
 Haiti
-
 Hong Kong
-
 Hungary
-
 India
-
 Indonesia
-
 Iran, Islamic republic
-
 Iraq
-
 Ireland
-
 Israel
-
 Italy
-
 Jamaica
-
 Japan
-
 Jordan
-
 Kazakhstan
-
 Kenya
-
 Korea
-
 Kuwait
-
 Kyrgyzstan
-
 Laos
-
 Latvia
-
 Lebanon
-
 Lesotho
-
 Libya
-
 Lithuania
-
 Luxembourg
-
 Madagascar
-
 Malaysia
-
 Malta
-
 Mauritius
-
 Mexico
-
 Moldova
-
 Mongolia
-
 Montenegro
-
 Morocco
-
 Mozambique
-
 Myanmar
-
 Namibia
-
 Nepal
-
 Netherlands
-
 New Zealand
-
 Nigeria
-
 North Macedonia
-
 Norway
-
 Oman
-
 Pakistan
-
 Palestine
-
 Panama
-
 Papua New Guinea
-
 Paraguay
-
 Peru
-
 Philippines
-
 Poland
-
 Portugal
-
 Puerto Rico
-
 Qatar
-
 Reunion
-
 Romania
-
 Rwanda
-
 Saudi Arabia
-
 Serbia
-
 Singapore
-
 Slovakia
-
 Slovenia
-
 Somalia
-
 South Africa
-
 Spain
-
 Sri Lanka
-
 Sweden
-
 Switzerland
-
 Syria
-
 Taiwan
-
 Tajikistan
-
 Tanzania
-
 Thailand
-
 Trinidad and Tobago
-
 Tunisia
-
 Turkey
-
 UAE
-
 Uganda
-
 Ukraine
-
 United Kingdom
-
United States
-
 Uruguay
-
 Uzbekistan
-
 Venezuela
-
 Vietnam
-
 Yemen
-
 Zambia
-
 Zimbabwe
- Forex
- Crypto












