


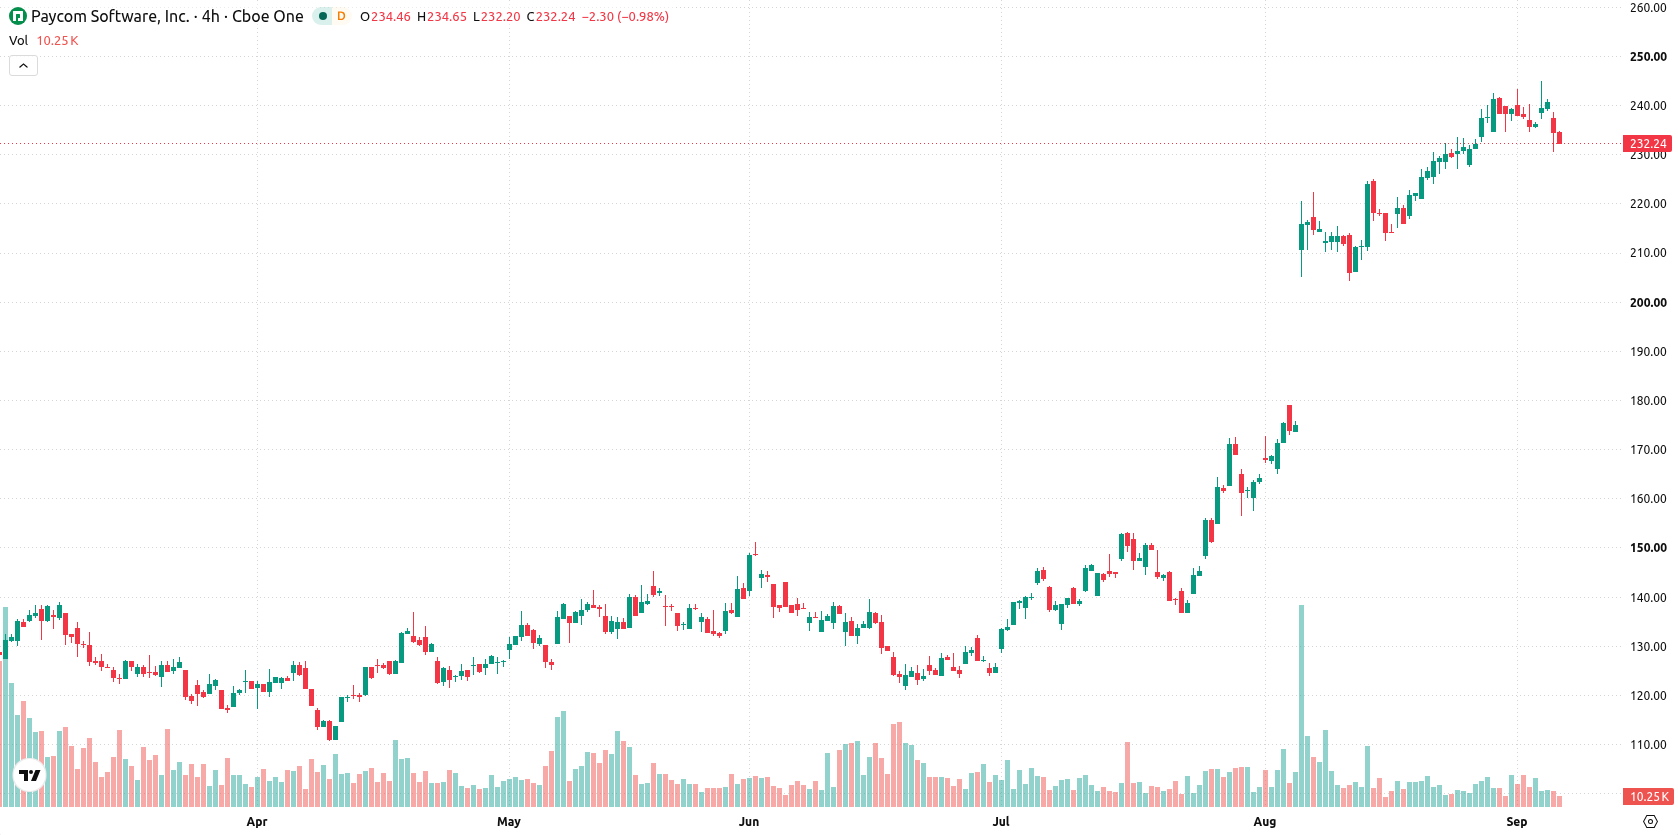
Paycom Software, Inc. (PAYC) declined 3.06% after recent gains, even as the company reported strong second quarter 2026 financials and raised its full-year outlook. The drop comes with the stock still trading above all major moving averages, which limits immediate downside momentum and keeps the underlying trend bullish.
 264.36
275.30
Highlights
- Paycom reported second quarter 2026 revenue of $531.2 million, a 10% increase year-over-year, with adjusted earnings per share of $2.78 surpassing consensus estimates.
- The company raised its full-year 2026 outlook and has repurchased about 20% of its shares since April 2026.
- Shares of Paycom trade in a strong upward trend above key averages, with a five-day expected range of $223.13 to $238.4 and technical indicators showing overbought conditions.
Share buybacks and guidance lift as sellers outweigh positive results
Paycom reported second quarter 2026 revenue of $531.2 million, representing a 10% increase year-over-year, and delivered adjusted earnings per share of $2.78, which exceeded consensus estimates. The company raised its full-year 2026 guidance following these results. Since April 2026, Paycom also repurchased about 20% of its shares, though price action has remained under broader selling pressure.
Bull momentum strengthens as overbought signals and volatility increase
Paycom is trading above its 20-day, 50-day, and 200-day moving averages ($226.21, $179.95, and $148.9 respectively), signaling strength over short-, medium-, and long-term periods. The alignment of the 50-day over the 200-day moving average confirms a bullish structural backdrop. Near-term resistance is seen at $234.48, with support at $230.56. Technical indicators show strong momentum, as both MACD and ADX are in buy alignment. The RSI at 78.63 and CCI at 110.06 indicate overbought conditions, and the Stochastic RSI reflects continued buying activity. Bull/Bear Power (BBP) at 14.51 demonstrates buyer dominance but also points to the overbought state. Paycom is currently at $233.15 after a notable downside gap at the open, with intraday volatility at 3.24%. Short-term momentum is still positive, but overbought readings suggest risk of reversal or consolidation.
Previously it was reported that Paycom demonstrated strong bullish momentum following robust financial results and increased share repurchases. The current analysis confirms this trend remains intact, with traders advised to monitor the $234.48 resistance level as a potential trigger for renewed upside movement.






Latest Paycom News




-
 Afghanistan
-
 Albania
-
 Algeria
-
 Angola
-
 Argentina
-
 Armenia
-
 Australia
-
 Austria
-
 Azerbaijan
-
 Bahamas
-
 Bahrain
-
 Bangladesh
-
 Belarus
-
 Belgium
-
 Bolivia
-
 Botswana
-
 Brazil
-
 Brunei
-
 Bulgaria
-
 Cambodia
-
 Cameroon
-
 Canada
-
 Chile
-
 China
-
 Colombia
-
 Congo
-
 Costa Rica
-
 Cote d'Ivoire
-
 Croatia
-
 Cuba
-
 Cyprus
-
 Czechia
-
 DR Congo
-
 Denmark
-
 Dominican Republic
-
 Ecuador
-
 Egypt
-
 El Salvador
-
 Estonia
-
 Eswatini
-
 Ethiopia
-
 Finland
-
 France
-
 Georgia
-
 Germany
-
 Ghana
-
 Greece
-
 Haiti
-
 Hong Kong
-
 Hungary
-
 India
-
 Indonesia
-
 Iran, Islamic republic
-
 Iraq
-
 Ireland
-
 Israel
-
 Italy
-
 Jamaica
-
 Japan
-
 Jordan
-
 Kazakhstan
-
 Kenya
-
 Korea
-
 Kuwait
-
 Kyrgyzstan
-
 Laos
-
 Latvia
-
 Lebanon
-
 Lesotho
-
 Libya
-
 Lithuania
-
 Luxembourg
-
 Madagascar
-
 Malaysia
-
 Malta
-
 Mauritius
-
 Mexico
-
 Moldova
-
 Mongolia
-
 Montenegro
-
 Morocco
-
 Mozambique
-
 Myanmar
-
 Namibia
-
 Nepal
-
 Netherlands
-
 New Zealand
-
 Nigeria
-
 North Macedonia
-
 Norway
-
 Oman
-
 Pakistan
-
 Palestine
-
 Panama
-
 Papua New Guinea
-
 Paraguay
-
 Peru
-
 Philippines
-
 Poland
-
 Portugal
-
 Puerto Rico
-
 Qatar
-
 Reunion
-
 Romania
-
 Rwanda
-
 Saudi Arabia
-
 Serbia
-
 Singapore
-
 Slovakia
-
 Slovenia
-
 Somalia
-
 South Africa
-
 Spain
-
 Sri Lanka
-
 Sweden
-
 Switzerland
-
 Syria
-
 Taiwan
-
 Tajikistan
-
 Tanzania
-
 Thailand
-
 Trinidad and Tobago
-
 Tunisia
-
 Turkey
-
 UAE
-
 Uganda
-
 Ukraine
-
 United Kingdom
-
United States
-
 Uruguay
-
 Uzbekistan
-
 Venezuela
-
 Vietnam
-
 Yemen
-
 Zambia
-
 Zimbabwe
- Forex
- Crypto












