

Dollar General stock selloff deepens: Downside targets to watch

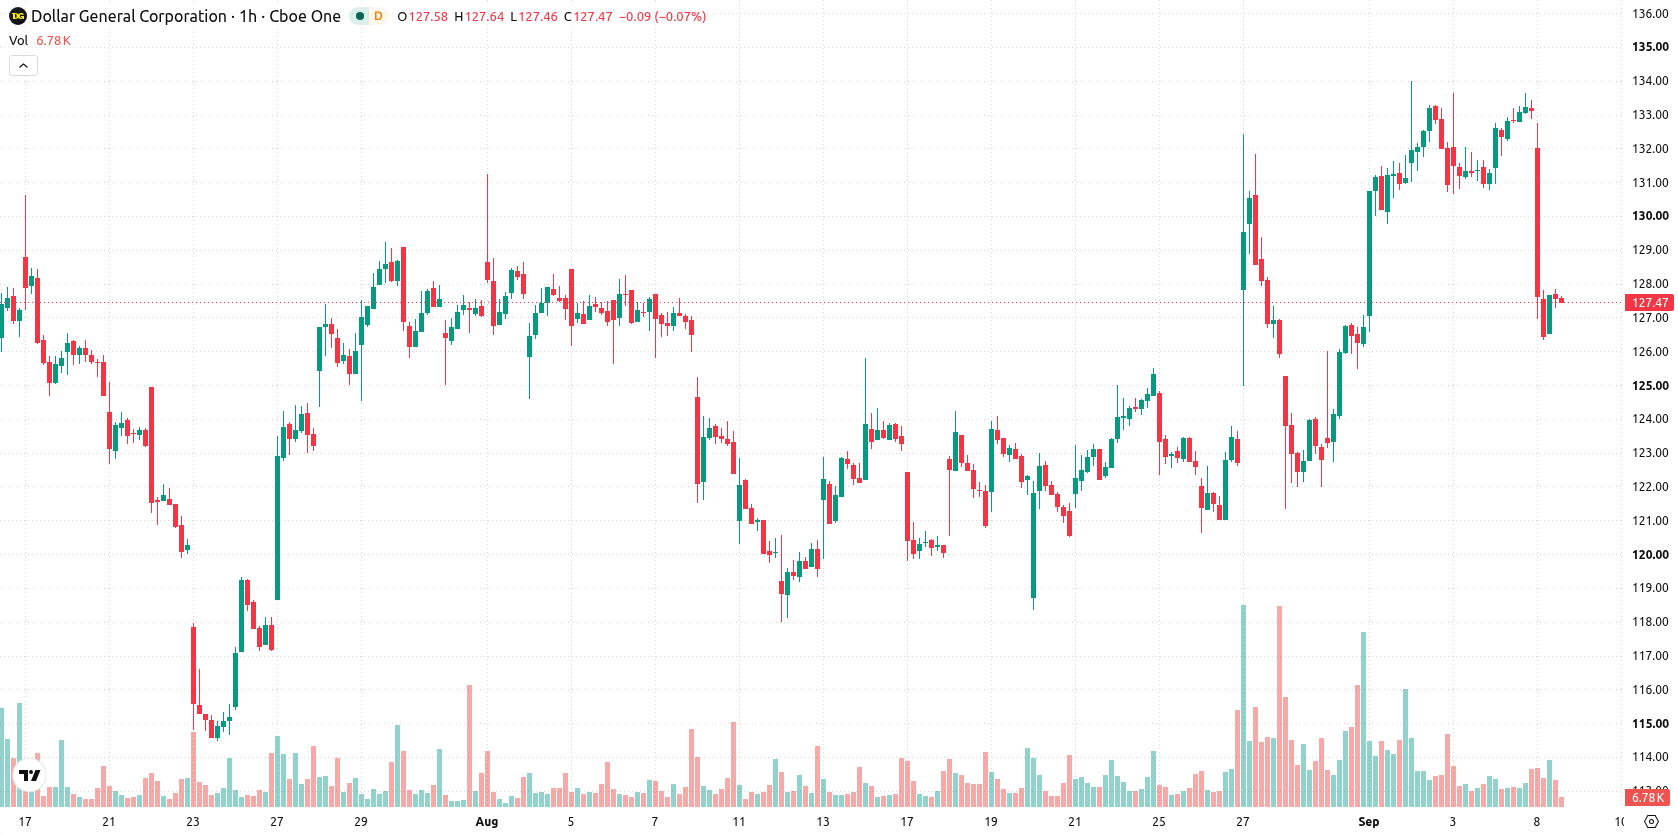
Dollar General (DG) stock is trading at $127.6 after a sharp daily drop of 4.16%, underperforming as it sits below its short- and medium-term moving averages with increased downside momentum.
 137.35
144.30
Highlights
- Dollar General reported second quarter sales of $11.29 billion, net income of $550.3 million, and earnings per share of $2.48, above the $2.01 consensus.
- Revenue increased 5.2% compared to last year, indicating resilient operations and improved performance for the quarter.
- Dollar General stock trades below short and medium-term moving averages, with intraday momentum favoring sellers and a forecasted price range of $122.02 to $128.99 over the next several days.
Earnings beat fails to offset selling pressure despite resilient growth
Dollar General reported second-quarter sales of approximately $11.29 billion and net income of $550.3 million, with earnings per share of $2.48 surpassing the $2.01 analyst consensus. The revenue increase of 5.2% year over year underscores resilience in the company’s business model and improved operational execution for the quarter. While these results would typically support sentiment, price action has remained under broader selling pressure.
Mixed signals and volatility emerge with sellers in near-term control
On the hourly chart, DG is trading below the MA-20 at $131.65 and the MA-50 at $129.1, while still holding above the MA-200 at $126.1. Immediate resistance is marked by the Ichimoku Kijun at $130.48. Technical indicators present mixed signals: MACD shows a Strong Buy, but ADX points to a Sell, and the RSI sits at 33.25, indicating oversold conditions. Both Stochastic RSI and CCI are also oversold, while Bull/Bear Power confirms sellers remain dominant intraday. The Awesome Oscillator is neutral, highlighting conflicting momentum amidst pronounced volatility.
Rangebound outlook persists as breakouts define next risk moves
Over the next two to three trading days, DG is expected to fluctuate within a typical volatility band between $122.02 and $128.99, with no clear directional bias. The baseline scenario anticipates DG/USD to remain rangebound inside these support and resistance levels. If a bullish breakout occurs above $130.48, it could trigger a reversal attempt, whereas a breach below $122.02 would open up further downside risk.
Earlier, analysts noted that Dollar General was demonstrating renewed technical strength supported by capital allocation initiatives and improved earnings. The current pullback introduces a change in outlook, and traders should now monitor the $130.48 resistance and $122.02 support as the key levels defining the near-term risk-reward setup.










-
 Afghanistan
-
 Albania
-
 Algeria
-
 Angola
-
 Argentina
-
 Armenia
-
 Australia
-
 Austria
-
 Azerbaijan
-
 Bahamas
-
 Bahrain
-
 Bangladesh
-
 Belarus
-
 Belgium
-
 Bolivia
-
 Botswana
-
 Brazil
-
 Brunei
-
 Bulgaria
-
 Cambodia
-
 Cameroon
-
 Canada
-
 Chile
-
 China
-
 Colombia
-
 Congo
-
 Costa Rica
-
 Cote d'Ivoire
-
 Croatia
-
 Cuba
-
 Cyprus
-
 Czechia
-
 DR Congo
-
 Denmark
-
 Dominican Republic
-
 Ecuador
-
 Egypt
-
 El Salvador
-
 Estonia
-
 Eswatini
-
 Ethiopia
-
 Finland
-
 France
-
 Georgia
-
 Germany
-
 Ghana
-
 Greece
-
 Haiti
-
 Hong Kong
-
 Hungary
-
 India
-
 Indonesia
-
 Iran, Islamic republic
-
 Iraq
-
 Ireland
-
 Israel
-
 Italy
-
 Jamaica
-
 Japan
-
 Jordan
-
 Kazakhstan
-
 Kenya
-
 Korea
-
 Kuwait
-
 Kyrgyzstan
-
 Laos
-
 Latvia
-
 Lebanon
-
 Lesotho
-
 Libya
-
 Lithuania
-
 Luxembourg
-
 Madagascar
-
 Malaysia
-
 Malta
-
 Mauritius
-
 Mexico
-
 Moldova
-
 Mongolia
-
 Montenegro
-
 Morocco
-
 Mozambique
-
 Myanmar
-
 Namibia
-
 Nepal
-
 Netherlands
-
 New Zealand
-
 Nigeria
-
 North Macedonia
-
 Norway
-
 Oman
-
 Pakistan
-
 Palestine
-
 Panama
-
 Papua New Guinea
-
 Paraguay
-
 Peru
-
 Philippines
-
 Poland
-
 Portugal
-
 Puerto Rico
-
 Qatar
-
 Reunion
-
 Romania
-
 Rwanda
-
 Saudi Arabia
-
 Serbia
-
 Singapore
-
 Slovakia
-
 Slovenia
-
 Somalia
-
 South Africa
-
 Spain
-
 Sri Lanka
-
 Sweden
-
 Switzerland
-
 Syria
-
 Taiwan
-
 Tajikistan
-
 Tanzania
-
 Thailand
-
 Trinidad and Tobago
-
 Tunisia
-
 Turkey
-
 UAE
-
 Uganda
-
 Ukraine
-
 United Kingdom
-
United States
-
 Uruguay
-
 Uzbekistan
-
 Venezuela
-
 Vietnam
-
 Yemen
-
 Zambia
-
 Zimbabwe
- Forex
- Crypto












