

What's behind Verizon's latest stock pullback?

Verizon Communications Inc. (VZ) slid 2.5% as the session opened, with today's move working against a backdrop of confirmed dividend stability and solid operational updates. The decline is at odds with the underlying technical posture, as Verizon remains above its 50-day and 200-day moving averages, limiting follow-through selling.
 45.16
45.16
Highlights
- Verizon stock maintained a quarterly dividend of 70.75 cents per share and raised its FY2026 adjusted EPS guidance and buyback target.
- The company confirmed $11.5 billion in cash dividends for 2025 and entered a multi-billion dollar supply agreement with Corning for over 80 million miles of optical fiber.
- Shares of Verizon fell 2.5% to $49.15, trading below short-term moving averages but holding a medium- to long-term bullish structure with a projected five-day range of $48.63 to $49.66.
Buyback boost and infrastructure deal contrast with sustained price pressure
Verizon Communications Inc. declared a quarterly dividend of 70.75 cents per share on September 9, 2026, maintaining its payout rate for shareholders of record by October 9. The company also reported entering a multi-billion dollar supply agreement with Corning for over 80 million miles of optical fiber to support broadband and AI infrastructure development. Verizon posted six consecutive earnings beats and raised its FY2026 adjusted EPS guidance and buyback target, accompanied by confirmation of $11.5 billion paid in cash dividends for 2025. These updates were highlighted at recent investor conferences, though price action has remained under broader selling pressure.
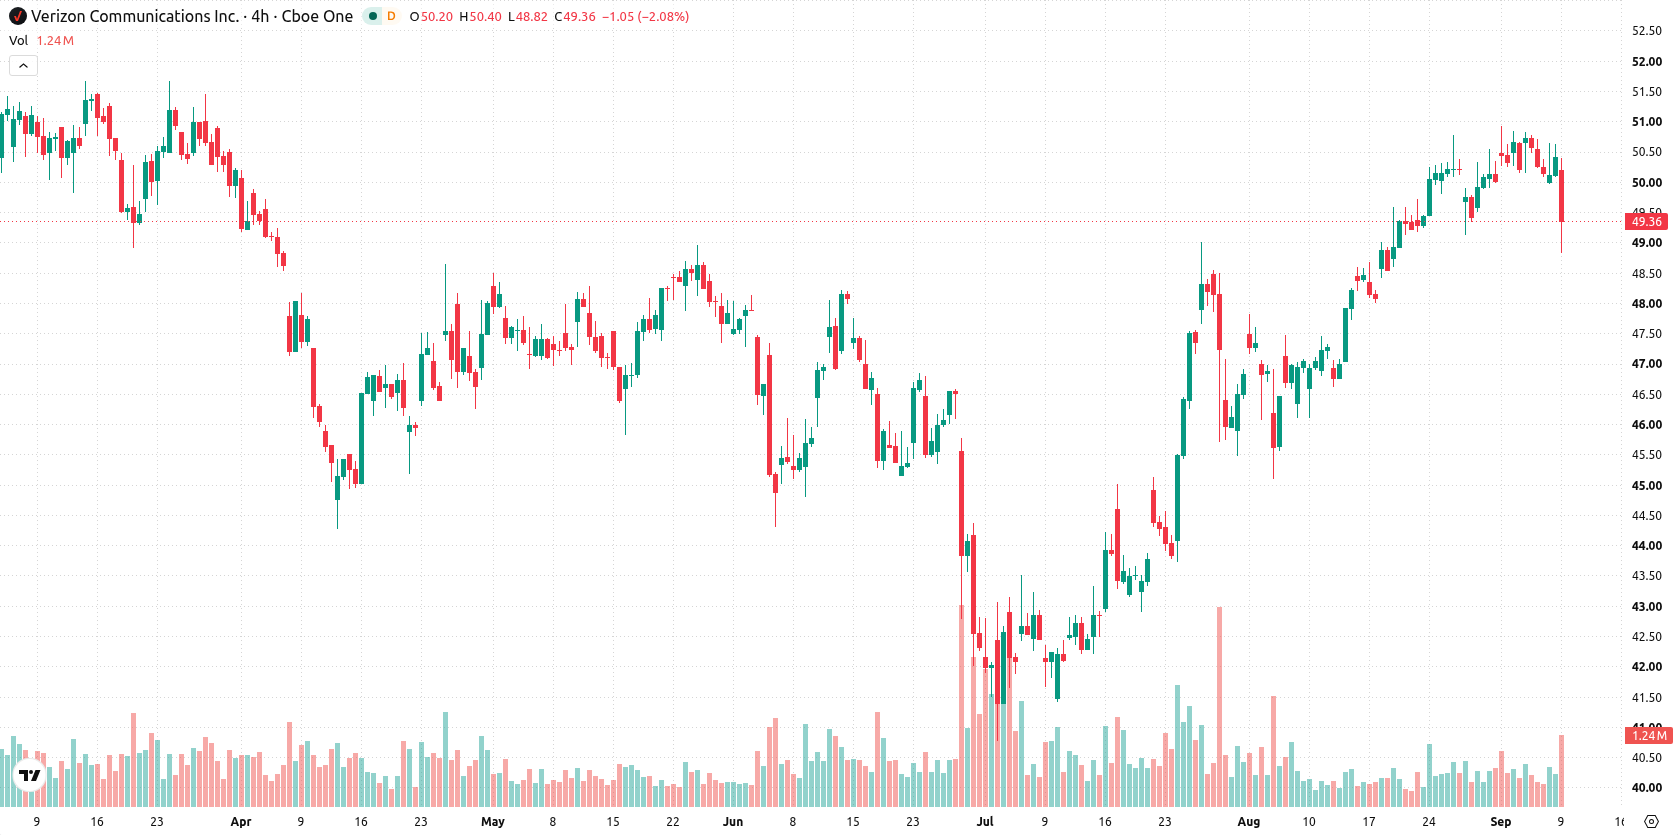
Positive momentum lingers as short-term weakness diverges from trend
Verizon is trading below the 20-day moving average at $49.36, but continues to hold above both the 50-day ($46.49) and 200-day ($45.76) moving averages, indicating short-term weakness within a still bullish medium- and long-term trend structure. Immediate resistance is at $49.36, with support at $48.63. MACD shows strong upside momentum, while the ADX at 16.8 signals trend indecision. The RSI is at 65, remaining in buy territory, and the CCI supports a bullish outlook. Stochastic RSI is neutral, reflecting no exhaustion, and Bull/Bear Power is positive at 0.79, indicating buyers are strong intraday. The daily chart reveals a downside gap of around 0.4% and a 2.5% drop to $49.15, near session lows, with intraday volatility at 0.92%. This presents a divergence between positive momentum readings and short-term price action.
Earlier, analysts noted that Verizon shares were likely to consolidate within a narrow range as technical signals approached overbought territory, despite ongoing growth initiatives. The current article adds that while short-term weakness has emerged, the prevailing scenario still favors a sideways move near recent levels, with $49.66 as a key resistance point to monitor for a potential bullish extension.






Latest Verizon News



-
 Afghanistan
-
 Albania
-
 Algeria
-
 Angola
-
 Argentina
-
 Armenia
-
 Australia
-
 Austria
-
 Azerbaijan
-
 Bahamas
-
 Bahrain
-
 Bangladesh
-
 Belarus
-
 Belgium
-
 Bolivia
-
 Botswana
-
 Brazil
-
 Brunei
-
 Bulgaria
-
 Cambodia
-
 Cameroon
-
 Canada
-
 Chile
-
 China
-
 Colombia
-
 Congo
-
 Costa Rica
-
 Cote d'Ivoire
-
 Croatia
-
 Cuba
-
 Cyprus
-
 Czechia
-
 DR Congo
-
 Denmark
-
 Dominican Republic
-
 Ecuador
-
 Egypt
-
 El Salvador
-
 Estonia
-
 Eswatini
-
 Ethiopia
-
 Finland
-
 France
-
 Georgia
-
 Germany
-
 Ghana
-
 Greece
-
 Haiti
-
 Hong Kong
-
 Hungary
-
 India
-
 Indonesia
-
 Iran, Islamic republic
-
 Iraq
-
 Ireland
-
 Israel
-
 Italy
-
 Jamaica
-
 Japan
-
 Jordan
-
 Kazakhstan
-
 Kenya
-
 Korea
-
 Kuwait
-
 Kyrgyzstan
-
 Laos
-
 Latvia
-
 Lebanon
-
 Lesotho
-
 Libya
-
 Lithuania
-
 Luxembourg
-
 Madagascar
-
 Malaysia
-
 Malta
-
 Mauritius
-
 Mexico
-
 Moldova
-
 Mongolia
-
 Montenegro
-
 Morocco
-
 Mozambique
-
 Myanmar
-
 Namibia
-
 Nepal
-
 Netherlands
-
 New Zealand
-
 Nigeria
-
 North Macedonia
-
 Norway
-
 Oman
-
 Pakistan
-
 Palestine
-
 Panama
-
 Papua New Guinea
-
 Paraguay
-
 Peru
-
 Philippines
-
 Poland
-
 Portugal
-
 Puerto Rico
-
 Qatar
-
 Reunion
-
 Romania
-
 Rwanda
-
 Saudi Arabia
-
 Serbia
-
 Singapore
-
 Slovakia
-
 Slovenia
-
 Somalia
-
 South Africa
-
 Spain
-
 Sri Lanka
-
 Sweden
-
 Switzerland
-
 Syria
-
 Taiwan
-
 Tajikistan
-
 Tanzania
-
 Thailand
-
 Trinidad and Tobago
-
 Tunisia
-
 Turkey
-
 UAE
-
 Uganda
-
 Ukraine
-
 United Kingdom
-
United States
-
 Uruguay
-
 Uzbekistan
-
 Venezuela
-
 Vietnam
-
 Yemen
-
 Zambia
-
 Zimbabwe
- Forex
- Crypto












