

Verizon stock weekly forecast: Volatility remains muted with outlook bracketed by technical barriers

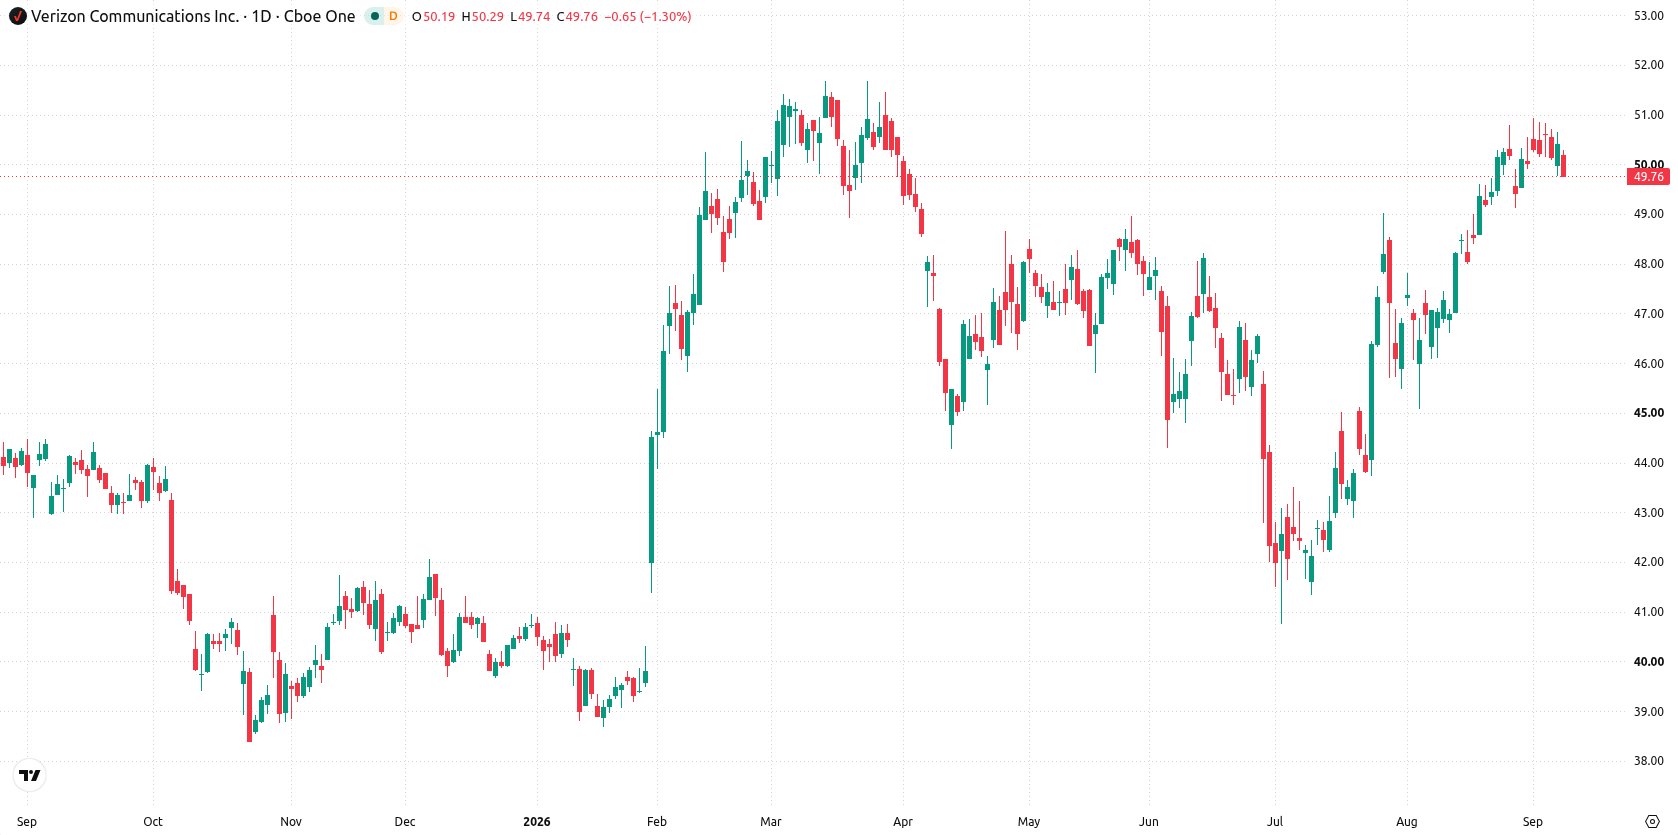
Shares of Verizon Communications Inc. (VZ) are trading near $49.80 as a recent rally has brought the stock into overbought territory. With the advance showing signs of exhaustion, traders will be watching whether support can hold and if volatility picks up as the week unfolds.
 45.16
45.16
Highlights
- Shares of Verizon closed at $49.81, holding well above key long-term moving averages and maintaining a bullish technical structure.
- Recent trading has been rangebound with volatility at 1.48%, while MACD signals strong momentum and RSI approaches overbought conditions.
- The expected trading range for the coming week is $49.47 to $53.01, with strong support at $49.36 and resistance at $50.06.
Growth initiatives and buybacks drive bullish sentiment amid capital inflows
According to GlobeNewswire and corroborated by Reuters and Yahoo Finance, VZ signed a multi-billion dollar supply agreement with Corning on September 8, 2026, set to significantly expand its optical fiber network and support future AI infrastructure needs through 2032. The Virginia Retirement Systems acquired more than 3.1 million shares of VZ in the second quarter, while the company raised its 2026 full-year adjusted EPS guidance and increased its share repurchase target to $4.5 billion, as highlighted at Citi’s 2026 Global TMT Conference. A record EBITDA and a continued quarterly dividend payout further underline VZ's strategic focus on growth and shareholder returns into the coming week.
Tight trading range persists as bullish momentum faces overbought signals
On the daily setup, the technical outlook points to a contained move within a narrow range, with volatility over the past week at 1.48%. The MACD continues to forecast a strong buy momentum, while the RSI reading of 65 is approaching overbought territory, hinting at possible near-term exhaustion even as underlying trend signals remain bullish. Nearby, the MA-20 at $49.36 serves as support, while resistance is close at $50.06, keeping the stock bracketed within tight boundaries.
Upside breakout risk grows as consolidation narrows ahead of forecast range
In the week ahead, the expected trading range stands between $49.47 and $53.01. There is a very high probability of an increase and a very low probability of a decrease. The base case sees shares consolidating above the $49.36 support and below resistance at $50.06. A break above $50.06 would open the way for a run toward the upper end of the forecast range, while a drop below $49.36 would put the $47.96 Ichimoku Kijun level into focus for potential support.
Earlier, analysts noted that Verizon shares were likely to consolidate in a narrow range as momentum indicators approached overbought conditions. The current article confirms this outlook while introducing newly enhanced fundamentals and technical signals, highlighting $50.06 as an immediate level to watch for a potential breakout in the days ahead.






Latest Verizon News



-
 Afghanistan
-
 Albania
-
 Algeria
-
 Angola
-
 Argentina
-
 Armenia
-
 Australia
-
 Austria
-
 Azerbaijan
-
 Bahamas
-
 Bahrain
-
 Bangladesh
-
 Belarus
-
 Belgium
-
 Bolivia
-
 Botswana
-
 Brazil
-
 Brunei
-
 Bulgaria
-
 Cambodia
-
 Cameroon
-
 Canada
-
 Chile
-
 China
-
 Colombia
-
 Congo
-
 Costa Rica
-
 Cote d'Ivoire
-
 Croatia
-
 Cuba
-
 Cyprus
-
 Czechia
-
 DR Congo
-
 Denmark
-
 Dominican Republic
-
 Ecuador
-
 Egypt
-
 El Salvador
-
 Estonia
-
 Eswatini
-
 Ethiopia
-
 Finland
-
 France
-
 Georgia
-
 Germany
-
 Ghana
-
 Greece
-
 Haiti
-
 Hong Kong
-
 Hungary
-
 India
-
 Indonesia
-
 Iran, Islamic republic
-
 Iraq
-
 Ireland
-
 Israel
-
 Italy
-
 Jamaica
-
 Japan
-
 Jordan
-
 Kazakhstan
-
 Kenya
-
 Korea
-
 Kuwait
-
 Kyrgyzstan
-
 Laos
-
 Latvia
-
 Lebanon
-
 Lesotho
-
 Libya
-
 Lithuania
-
 Luxembourg
-
 Madagascar
-
 Malaysia
-
 Malta
-
 Mauritius
-
 Mexico
-
 Moldova
-
 Mongolia
-
 Montenegro
-
 Morocco
-
 Mozambique
-
 Myanmar
-
 Namibia
-
 Nepal
-
 Netherlands
-
 New Zealand
-
 Nigeria
-
 North Macedonia
-
 Norway
-
 Oman
-
 Pakistan
-
 Palestine
-
 Panama
-
 Papua New Guinea
-
 Paraguay
-
 Peru
-
 Philippines
-
 Poland
-
 Portugal
-
 Puerto Rico
-
 Qatar
-
 Reunion
-
 Romania
-
 Rwanda
-
 Saudi Arabia
-
 Serbia
-
 Singapore
-
 Slovakia
-
 Slovenia
-
 Somalia
-
 South Africa
-
 Spain
-
 Sri Lanka
-
 Sweden
-
 Switzerland
-
 Syria
-
 Taiwan
-
 Tajikistan
-
 Tanzania
-
 Thailand
-
 Trinidad and Tobago
-
 Tunisia
-
 Turkey
-
 UAE
-
 Uganda
-
 Ukraine
-
 United Kingdom
-
United States
-
 Uruguay
-
 Uzbekistan
-
 Venezuela
-
 Vietnam
-
 Yemen
-
 Zambia
-
 Zimbabwe
- Forex
- Crypto












