

Verizon stock weekly forecast: Technicals point to further consolidation unless resistance at $50.78 breaks

Shares of Verizon Communications Inc. (VZ) are trading near $50 as the recent rally faces overbought conditions. The corporate backdrop favors consolidation, with momentum cooling but buyers remaining active. This setup could carry into the week ahead as investors gauge the staying power of demand.
 44.98
44.46
Highlights
- Shares of Verizon closed at $49.99, slightly lower over the past week while remaining above key long-term averages.
- The stock is consolidating in a narrow range with volatility at 3.25% and momentum signals mixed between overbought and ongoing buy signals.
- Expected movement for the next five days is contained in the $48.92 to $50.7 range, with strong buying pressure unless support at $49.18 breaks.
Expanded AI partnership and stable dividends drive mixed news sentiment
Verizon announced an expanded partnership with Google Cloud to integrate Gemini Enterprise AI across its customer service, network operations, and marketing, as reported by Simply Wall St and detailed by TechTimes and Light Reading. The company noted that Gemini Enterprise now supports most inbound customer calls and enhances automation efforts, while dividend yields remain above 5% with a steady growth history, according to GuruFocus and Investing.com. Other news included a slight earnings beat for Q2 2026 with a minor revenue dip, and recent SEC filings showed mixed institutional moves and an insider share sale, as summarized by Defense World, MarketBeat, and Investing.com.
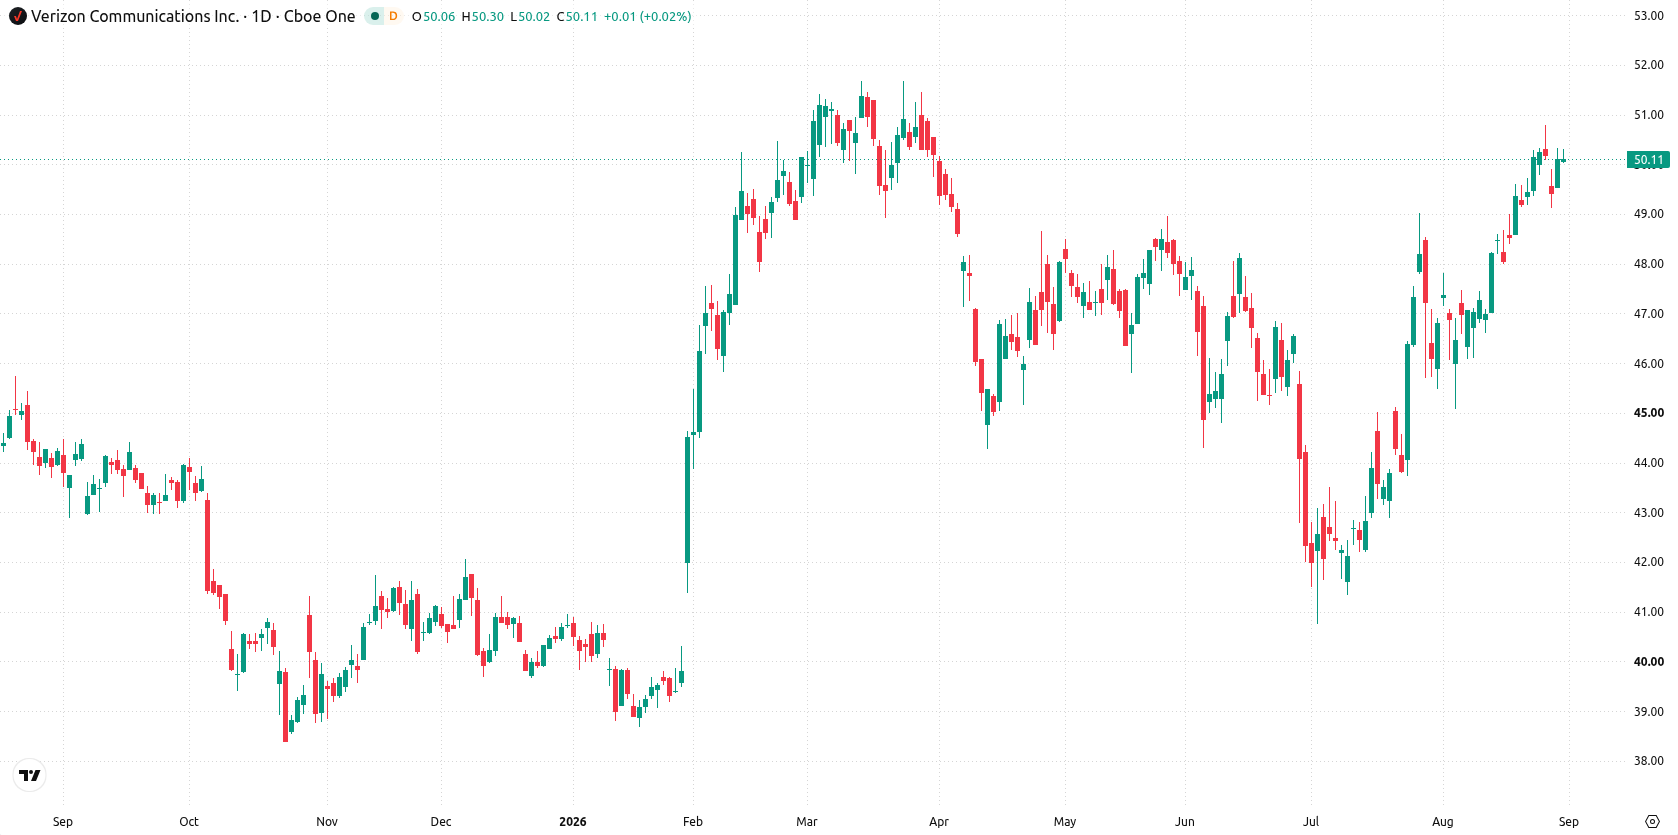
Rangebound momentum prevails this week amid looming overbought signals
On the daily chart, price action reflects a contained move within a narrow range, with volatility over the past week at 3.25%. Momentum readings are mixed: RSI at 65.93 is approaching overbought conditions, while MACD remains in buy territory. The nearest support sits at $49.18, with resistance at $50.78 and the Ichimoku Kijun at $47.83 providing a further support level. This technical setup implies continued consolidation, but buying pressure dominates unless the lower boundary is tested.
Consolidation bias holds for next week barring breakout above resistance
For the next five trading days, expected movement is contained within the $48.92 to $50.7 range. There is a very high probability of an increase and a very low probability of a decline. The base case is consolidation near current levels unless price breaks above resistance at $50.78, which would open room for further gains. A drop below support at $49.18 would be required to shift the near-term view to outright bearish.
Earlier, analysts noted that despite bullish structures and positive corporate developments, Verizon faced short-term selling pressures and signals of potential consolidation. The current article reinforces this consolidation outlook, highlighting a narrow trading range ahead and identifying $50.78 as the next upside level to watch for a possible breakout.









-
 Afghanistan
-
 Albania
-
 Algeria
-
 Angola
-
 Argentina
-
 Armenia
-
 Australia
-
 Austria
-
 Azerbaijan
-
 Bahamas
-
 Bahrain
-
 Bangladesh
-
 Belarus
-
 Belgium
-
 Bolivia
-
 Botswana
-
 Brazil
-
 Brunei
-
 Bulgaria
-
 Cambodia
-
 Cameroon
-
 Canada
-
 Chile
-
 China
-
 Colombia
-
 Congo
-
 Costa Rica
-
 Cote d'Ivoire
-
 Croatia
-
 Cuba
-
 Cyprus
-
 Czechia
-
 DR Congo
-
 Denmark
-
 Dominican Republic
-
 Ecuador
-
 Egypt
-
 El Salvador
-
 Estonia
-
 Eswatini
-
 Ethiopia
-
 Finland
-
 France
-
 Georgia
-
 Germany
-
 Ghana
-
 Greece
-
 Haiti
-
 Hong Kong
-
 Hungary
-
 India
-
 Indonesia
-
 Iran, Islamic republic
-
 Iraq
-
 Ireland
-
 Israel
-
 Italy
-
 Jamaica
-
 Japan
-
 Jordan
-
 Kazakhstan
-
 Kenya
-
 Korea
-
 Kuwait
-
 Kyrgyzstan
-
 Laos
-
 Latvia
-
 Lebanon
-
 Lesotho
-
 Libya
-
 Lithuania
-
 Luxembourg
-
 Madagascar
-
 Malaysia
-
 Malta
-
 Mauritius
-
 Mexico
-
 Moldova
-
 Mongolia
-
 Montenegro
-
 Morocco
-
 Mozambique
-
 Myanmar
-
 Namibia
-
 Nepal
-
 Netherlands
-
 New Zealand
-
 Nigeria
-
 North Macedonia
-
 Norway
-
 Oman
-
 Pakistan
-
 Palestine
-
 Panama
-
 Papua New Guinea
-
 Paraguay
-
 Peru
-
 Philippines
-
 Poland
-
 Portugal
-
 Puerto Rico
-
 Qatar
-
 Reunion
-
 Romania
-
 Rwanda
-
 Saudi Arabia
-
 Serbia
-
 Singapore
-
 Slovakia
-
 Slovenia
-
 Somalia
-
 South Africa
-
 Spain
-
 Sri Lanka
-
 Sweden
-
 Switzerland
-
 Syria
-
 Taiwan
-
 Tajikistan
-
 Tanzania
-
 Thailand
-
 Trinidad and Tobago
-
 Tunisia
-
 Turkey
-
 UAE
-
 Uganda
-
 Ukraine
-
 United Kingdom
-
United States
-
 Uruguay
-
 Uzbekistan
-
 Venezuela
-
 Vietnam
-
 Yemen
-
 Zambia
-
 Zimbabwe
- Forex
- Crypto












